


- Yokohama-shi Top Page
- Lifestyle and procedures
- Housing and Living
- Housing
- Plans, council, statistical data, etc.
- Housing-related statistical data
- Housing conditions 3-1: Housing Stocks
Here's the text.
Housing conditions 3-1: Housing Stocks
Last Updated January 28, 2020
Changes in the number of houses and vacant houses in Yokohama City
The total number of homes and the number of residences with households continuing to increase.
As of October 1, 2018, the total number of houses in Yokohama City was 1,835,800, of which 1,649,000 houses have resident households, which can be said to be sufficient in terms of the number of units.
In addition, with the increase in the number of houses, the number of vacant houses is also increasing. The ratio of the number of vacant houses to the total number of houses has decreased slightly since the 2013 survey due to an increase in the total number of houses, but since it still accounts for about 10%, effective use of stock is desired (Fig. 3-1-1).
※The term "vacant house" here refers to a house that has become an unoccupied house for rental or sale. The “number of vacant houses” does not include houses that are used only in the daytime, or houses under construction, so the difference between the “total number of houses” and “number of houses with resident households” does not match .
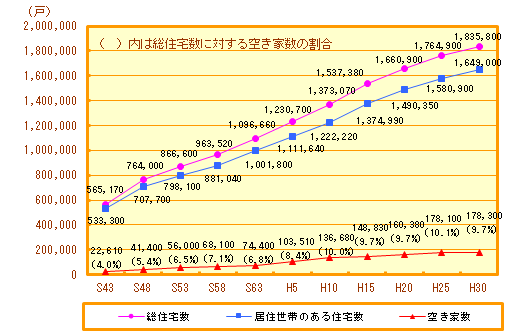
Figure 3-1-1 Changes in the number of houses and vacant houses in Yokohama
Document: Ministry of Internal Affairs and Communications, Ministry of Internal Affairs and Communications, “Housing and Land Statistics Survey from 1993 to 1995”, “10, 15, 20, 25, and 30 years”
Changes in the number of houses by construction period
The ratio of houses over 30 years old and houses about 30 years old were 25% in 2008 (built before 1980), but in 2018 it was 37.2% in 2018 (Building before 1990), and the proportion of old houses is increasing (Fig. 3-1-2).
For this reason, the structural parts and equipment of houses are aging, and the obsolete of housing functions are progressing, and it is necessary to secure a good living environment while promoting appropriate renovation and renewal.
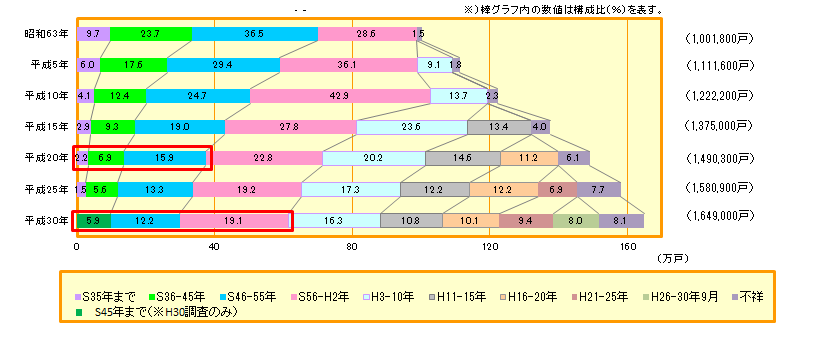
Figure 3-1-2 Changes in the number of houses in Yokohama by construction period
Document: Ministry of Internal Affairs and Communications, “Housing Statistics Survey 1988 / 1993 Housing and Land Statistics Survey, Heisei 10, 15, 20, 25, and 30 years”
Total number of housing units and rate of increase in each ward
From 2013 to 2018, there was no ward where the increase rate of the total number of houses exceeded 10%.
As of 2018, nine wards with a total of more than 100,000 houses are Tsurumi Ward, Kanagawa Ward, Minami Ward, Hodogaya Ward, Konan Ward, Totsuka Ward, Asahi Ward, Aoba Ward and Kohoku Ward. (Fig. 3-1-3).
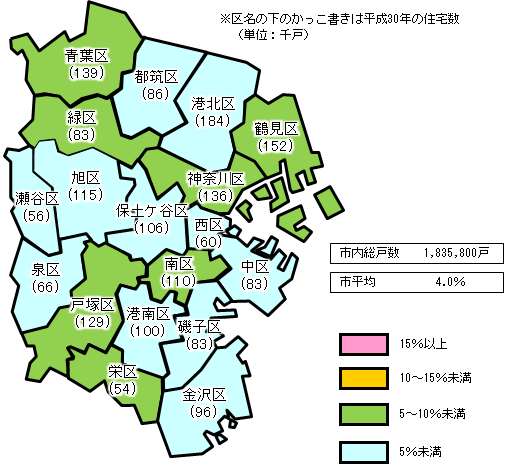
Figure 3-1-3 Total number of houses in each ward (2018) and rate of increase (2013 to 30)
Document: Ministry of Internal Affairs and Communications “2013 Survey on Housing and Land Statistics”
For inquiries to this page
Building Bureau Housing Department Housing Policy Division
Phone: 045-671-3975
Phone: 045-671-3975
Fax: 045-641-2756
Email address: kc-jutakuseisaku@city.yokohama.jp
Page ID: 374-760-389


