


- Yokohama-shi Top Page
- Living and Procedures
- Housing and Living
- Housing
- Planning, council, statistical data, etc. related to housing
- Housing-related statistical data
- Housing conditions 1-2: Declining Birthrate, Aging, and Small Ages
Here's the text.
Housing conditions 1-2: Declining Birthrate, Aging, and Small Ages
Last Updated December 24, 2021
Changes in the birth rate and total fertility rate in Yokohama
Since 1975 (Showa 50), the total fertility rate (* 1) in Yokohama has been below 2.08, which is the level necessary to maintain the current population.
In 2004, it fell to 1.14, but in 2019, it was 1.26.
The birth rate (* 2) continued to decrease from 20.6 / 1,000 in 1974 (Showa 49) in the second baby boom, reaching 6.8 / 1,000 in 2019 (Ryowagen), and the birthrate is declining (Fig. 1-2-1).

Figure 1-2-1 Changes in the birth rate and total fertility rate in Yokohama City
Materials: The total fertility rate is "Yokohama City Health Statistics Annual Report", and the birth rate is "Yokohama City Statistical Report".
※1 Total fertility rate…The average number of children a woman gives birth to a woman in her lifetime
※2 Birth Rate…Figures obtained by converting the number of children born during the year into population/1,000
Trends in Population by Age in Yokohama City
Comparing the changes in the population by age in Yokohama in 1990 (Heisei 2) and 2020 (Reiwa 2), the young population in 2020 (Reiwa 2), while the elderly population is increasing and the population is aging (Fig.1-2-2).
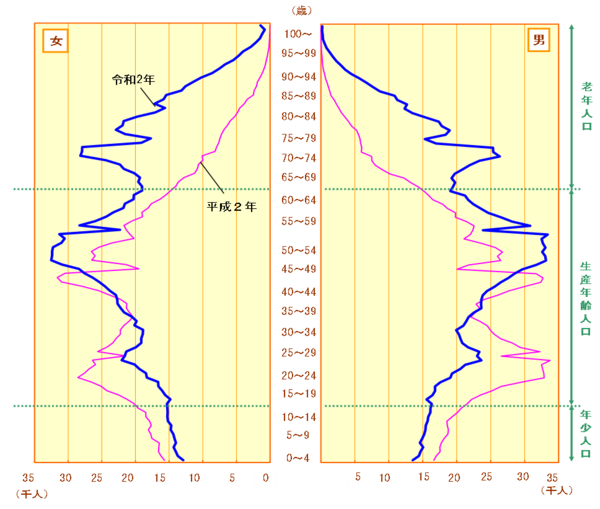
Figure 1-2-2 Graph of Changes in Population by Age in Yokohama City
Materials: Policy Bureau, Yokohama City Statistical Report
Changes in the population by age group in Yokohama City
Looking at the transition by age group into three categories, the ratio of the elderly population to the total population is about three times in the 25 years from 1995 (Heisei 7) to 2020 (Ryowa 2). . Among them, the proportion of elderly singles is gradually increasing, and there is an urgent need to respond to an aging society (Figure 1-2-3).

Figure 1-2-3 Changes in the population by age group in Yokohama City
Materials: Ministry of Internal Affairs and Communications "1995 (Heisei 7)-2020 (Reiwa 2) Census"
※The young population is under 15 years old, the working-age population is between 15 and 64 years old, and the elderly population is over 65 years old.
Changes in the number of employees per household in Yokohama
The number of employees per household in Yokohama has been decreasing year by year, decreasing from 2.91 in 1985 (Showa 60) to 2.14 in 2021 (Figure 1-2-4).
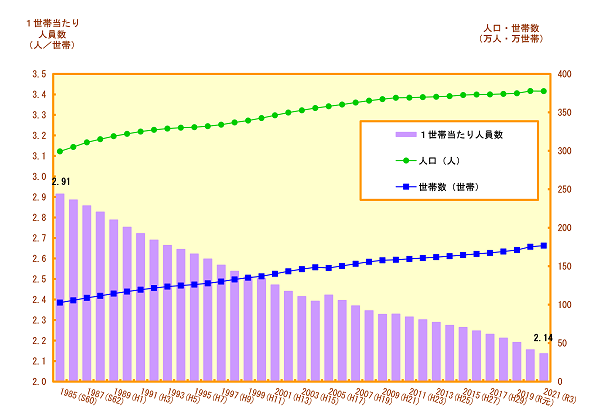
Figure 1-2-4 Changes in the number of employees per household in Yokohama City
Materials: Policy Bureau, Yokohama City Population News
Trends in the percentage of households by household in Yokohama City
Looking at the trends in the number of households by household number, the percentage of single-person households is increasing, while the percentage of households with three or more people is decreasing, and small-grouping is progressing due to the declining birthrate and the increase in single-person households (Fig.1-2-5).
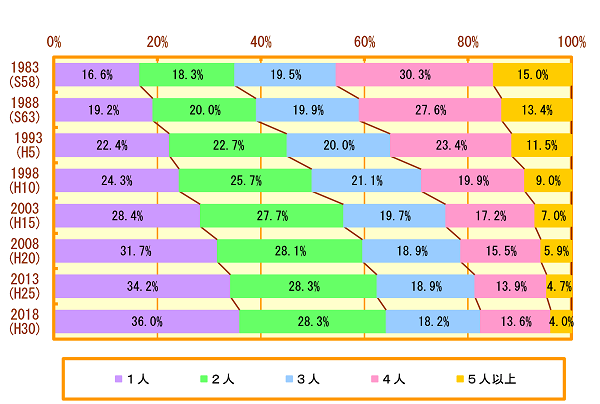
Figure 1-2-5 Changes in the percentage of households by household in Yokohama City
Materials: Ministry of Internal Affairs and Communications, “1983 (Showa 58) - 1993 (Heisei 5) Housing Statistics Survey”
"1998 (Heisei 10)-2018 (Heisei 30) Housing and Land Statistics Survey"
Inquiries to this page
Housing Policy Division, Building Bureau Housing Department
Telephone: 045-671-3975
Telephone: 045-671-3975
Fax: 045-641-2756
Email address: kc-jutakuseisaku@city.yokohama.lg.jp
Page ID: 778-682-815


