- Yokohama-shi Top Page
- Living and Procedures
- Housing and Living
- Housing
- Planning, council, statistical data, etc. related to housing
- Housing-related statistical data
- Housing conditions 3-5: Living area level
Here's the text.
Housing conditions 3-5: Living area level
Last Updated December 9, 2022
Changes in the number of households living in houses below the minimum living area level (by ownership of houses)
In 1993, there were 125,700 households below the minimum living area level, accounting for 11.3% of the total households, but in 2018, 129,900 households, accounting for 7.9% of the total households.
Looking at the breakdown, it can be seen that non-wooden private-sector houses account for more than 50%, and the proportion of houses below the minimum living area level is increasing (Figure 3-5-1).
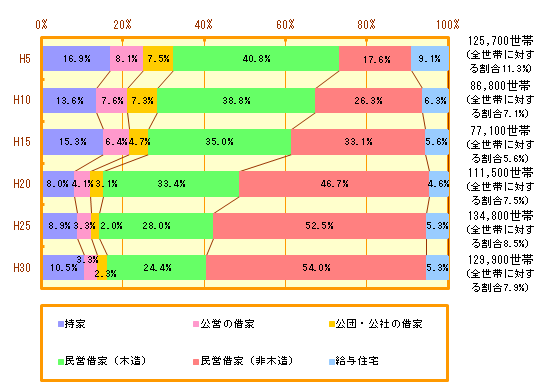
Figure 3-5-1 Changes in the number of households living in houses below the minimum living area level (by ownership of houses) (Yokohama City)
Materials: Ministry of Internal Affairs and Communications “1993 Housing Statistics Survey”, “Heisei 10, 15, 20, 25, 30 Housing and Land Statistics Survey”
Changes in the number of households living in houses below the minimum living area level (by ownership of houses)
Compared to the previous survey in 2013, it can be seen that the number of households living in houses below the minimum living area level has decreased in rented houses (Figure 3-5-2).
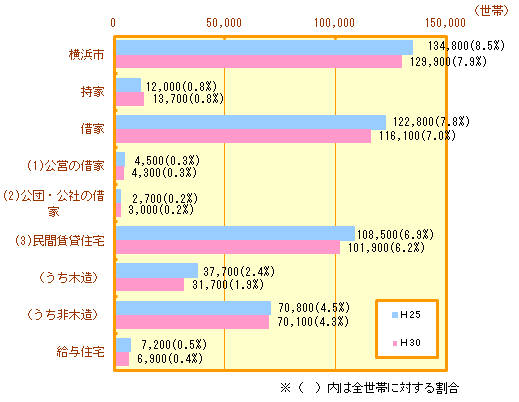
Figure 3-5-2 Changes in the number of households living in houses below the minimum living area level (by ownership of houses) (Yokohama City)
Materials: Ministry of Internal Affairs and Communications “Housing and Land Statistics Survey 2013/30”
Changes in the number of households living in houses below the minimum living area level (by age of the head of household)
Looking at households living in houses below the minimum living area level by age of the head of household, the percentage of households in their 30s and 40s is high, and in recent years the percentage of those aged 60 and over has increased. (Fig.3-5-3).
(The standard of living area before 2003 in this housing situation is based on the standard of living in the Housing Construction Goka Annual Plan.)
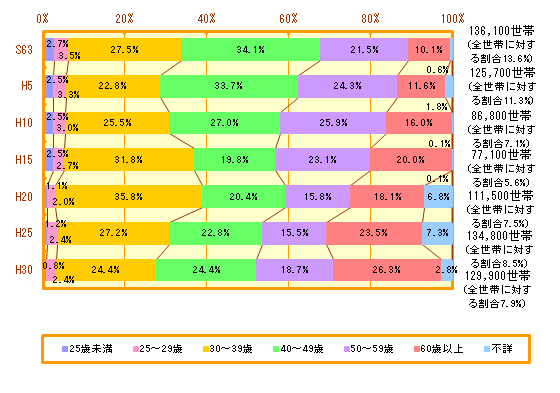
Figure 3-5-3 Number of households living in houses below the minimum living area level (by age of head of household) (Yokohama City)
Materials: Ministry of Internal Affairs and Communications “Showa 63 / 1993 Housing Statistics Survey”, “Heisei 10, 15, 20, 20, 25, and 30 Housing and Land Statistics Survey”
Living area level in the Basic Plan for Living Life
The “living standard” is the goal set by the Ministry of Land, Infrastructure, Transport and Tourism in the Goka Annual Housing Construction Plan up to 2005 so that the people can live a stable and comfortable living life. In 2006, instead of the Housing Construction Goka Annual Plan, a basic plan for living and living was established, and the previous "living standard" was also reviewed as "living area standard".
There are two types of living area standards: "minimum living area standard" and "guided living area standard". The “minimum living area standard” is the standard related to the area of housing that is indispensable as the basis for a healthy and cultural living life according to the number of households, and the “guided living area standard” is based on the number of households. It is a level related to the area of housing that is considered necessary to respond to various lifestyles as a prerequisite for realizing a rich living life.
Guided living area level is divided into "general-type guided living area level" assuming detached housing in general areas other than the suburbs and urban areas of cities, and "urban-type guided living area level" assuming apartment housing in and around the city (Fig.3-5-4-A).
The living area level in the Housing and Land Statistics Survey prior to 2003 is based on the living standard in the Housing Construction Goka Annual Plan (Figure 3-5-4-B).
| Number of Households | Minimum living area level | Urban living type Guided living area level (Condominium) | General type |
|---|---|---|---|
| Single-person households | 25㎡ | 40㎡ | 55㎡ |
| 2-person household | 30㎡ [If there is one child aged 3 to 5 years, 30 m2] | 55㎡ [55m2 if there is one child between 3 and 5 years old] | 75㎡ [75m2 if there is one child between 3 and 5 years old] |
| 3-person household | 40㎡ [If there is one child aged 3 to 5 years, 35 m2] | 75㎡ [If there is one child aged 3 to 5 years, 65 m2] | 100㎡ [87.5m2 if there is one child between 3 and 5 years old] |
| 4-person household | 50㎡ [If there is one child aged 3 to 5 years, 45 m2] | 95㎡ [85m2 if there is one child between 3 and 5 years old] | 125㎡ [112.5m2 if there is one child between 3 and 5 years old] |
| Number of Households | Minimum residence Level | Urban living-type induction living standard | General induction living standard |
|---|---|---|---|
| Single-person households | 18㎡ | 37㎡ | 50㎡ |
| 2-person household | 29㎡ | 55㎡ | 72㎡ |
| 3-person household | 39㎡ | 75㎡ | 98㎡ |
| 4-person household | 50㎡ | 91㎡ | 123㎡ |
Percentage of households living in houses with a minimum living standard (by household number)
There are almost no households with a minimum living standard in their own homes, and in 2018, only 1.4% of the total homes owned. More than 60% of households have achieved the induction living standard, but about 70% of households with 4 or 5 or more people have less than the induction living standard. (Fig.3-5-5).
In rented houses, households with less than the minimum living standard are less than 20%, but more than 20% of single-person and five-person households are more than 20%. In addition, about 70% of the total rented houses are less than the induction living standard. (Fig.3-5-6).
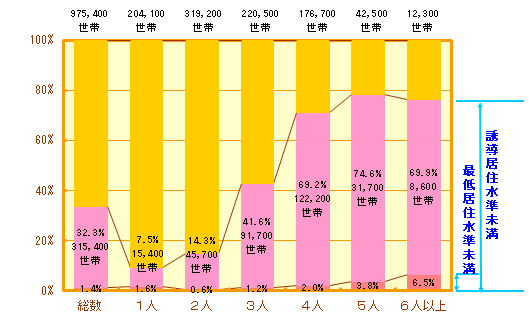
Figure 3-5-5 Percentage of owned households living in houses with less than the minimum living standard (by household number) (Yokohama City)
Materials: Ministry of Internal Affairs and Communications, “2018 Housing and Land Statistics Survey”
※Percentage values below the induction living standard include below the minimum living standard.
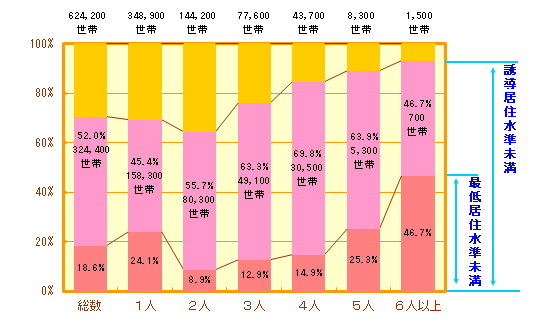
Figure 3-5-6 Percentage of rented households living in houses with less than the minimum living standard (by household number) (Yokohama City)
Materials: Ministry of Internal Affairs and Communications, “2018 Housing and Land Statistics Survey”
Percentage of households living in houses below the induction living standard (by construction period)
In houses built between 2016 and 30 years, about 60% of owned houses and about 30% of rented houses have achieved induction living standards.
However, in old rented houses during construction period, the achievement rate of inductive living standards tends to be low. (Figure 3-5-7, Fig. 3-5-8).
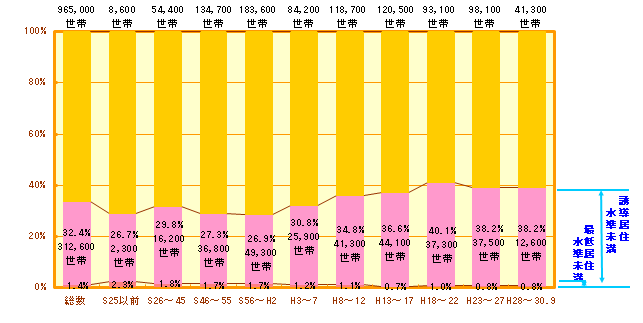
Figure 3-5-7 Percentage of owned households living in houses less than the induction living standard (by construction period) (Yokohama City)
Materials: Ministry of Internal Affairs and Communications, “2018 Housing and Land Statistics Survey”
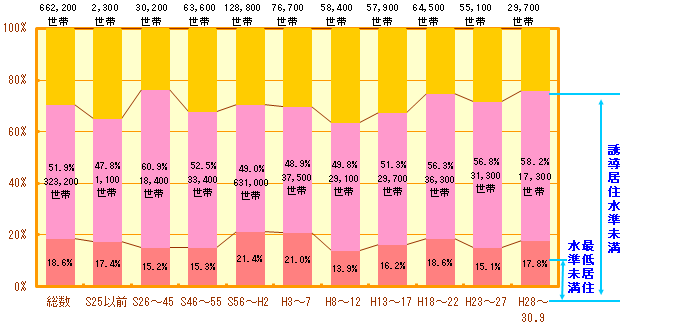
Figure 3-5-8 Percentage of rented households living in houses less than the induction living standard (by construction period) (Yokohama City)
Materials: Ministry of Internal Affairs and Communications, “2018 Housing and Land Statistics Survey”
Inquiries to this page
Housing Policy Division, Building Bureau Housing Department
Telephone: 045-671-3975
Telephone: 045-671-3975
Fax: 045-641-2756
Email address: kc-jutakuseisaku@city.yokohama.lg.jp
Page ID: 550-384-931


