- Yokohama-shi Top Page
- Living and Procedures
- Housing and Living
- Housing
- Planning, council, statistical data, etc. related to housing
- Housing-related statistical data
- Housing Conditions 3-7: Aging Society and Housing
Here's the text.
Housing Conditions 3-7: Aging Society and Housing
Last Updated December 9, 2022
Number of Elderly Households
The number of elderly households is increasing rapidly, with 203,500 single-person households and 186,700 couples only increasing in 2018, and single-person households increasing about four times in 15 years. . In addition, the number of households where the elderly live together was 241,800 in 2018, an increase of about 1.3 times in 15 years.
The ownership rate of elderly households is as high as 84.9% for couples only and 83.7% for households with elderly people living together. However, the ownership rate of single-person households is 64.4%, which is low among elderly households (Figure 3-7-1).
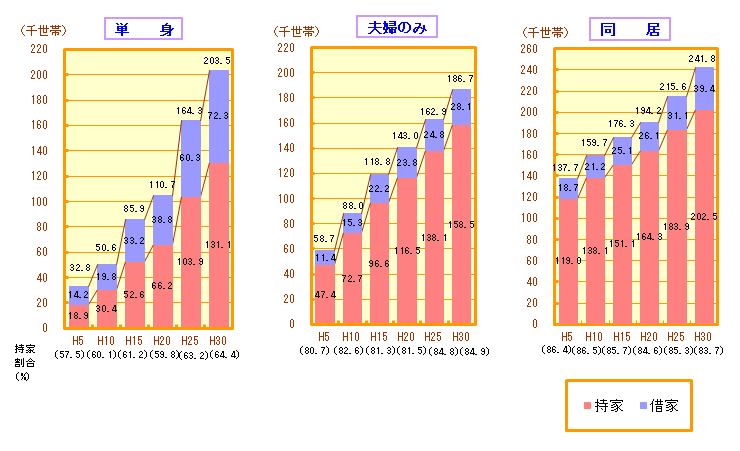
Figure 3-7-1 Changes in the number of elderly households in Yokohama
Materials: Ministry of Internal Affairs and Communications “1993 Housing Statistics Survey”, “Heisei 10, 15, 20, 25, 30 Housing and Land Statistics Survey”
Changes in the percentage of households with elderly people
Of the total number of households, households with elderly people increased from 20.8% in 1993 to 38.3% in 2018 (Figure 3-7-2).
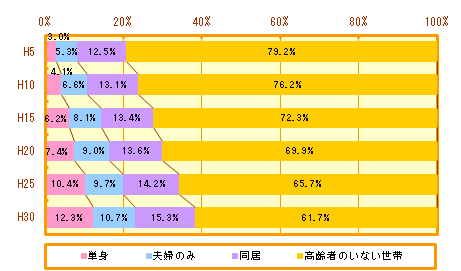
Figure 3-7-2 Changes in the percentage of households with elderly people among the total number of main households in Yokohama City
Materials: Ministry of Internal Affairs and Communications “1993 Housing Statistics Survey”, “Heisei 10, 15, 20, 25, 30 Housing and Land Statistics Survey”
Estimation of the aging rate in each ward
As of 2015, Tsuzuki Ward , Kohoku Ward, and Nishi Ward have low aging rates, while Sakae Ward, Asahi Ward and Izumi Ward have high aging rates.
Comparing the aging situation with the actual value of 2015 (Heisei 27) and the estimated value of 2040 (Heisei 52), the aging rate is expected to increase in all wards. In general, the rate of aging is larger in suburban wards than in wards near the city center (Fig.3-7-3).
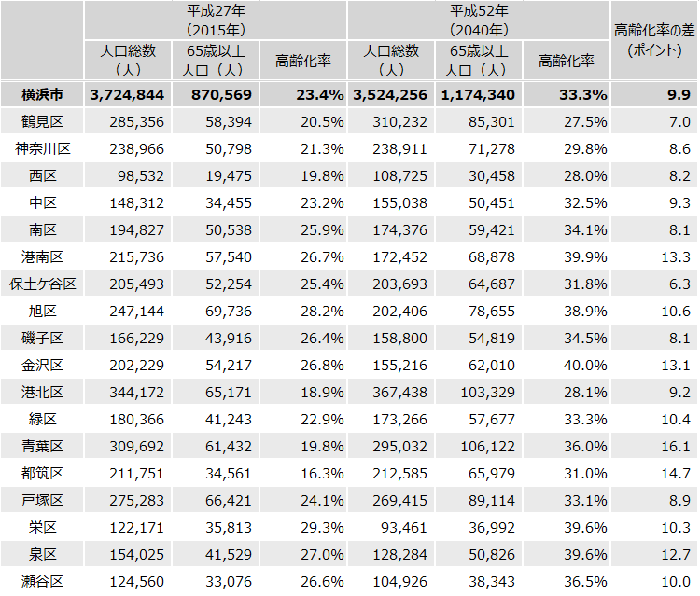
Figure 3-7-3A Estimation of the aging rate in each ward
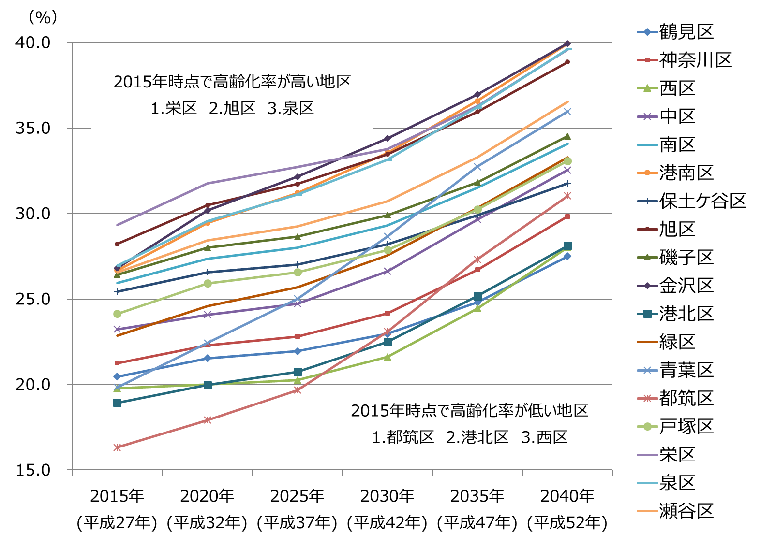
Figure 3-7-3B Estimation of aging rate in each ward
Document “Future Population Estimation of Yokohama City (base time of 2015) (Policy Bureau, Yokohama City)
The estimates are based on intermediate values.
Living standard of households with elderly people
There is a large difference in the living standard of elderly households between their own homes and rented homes. Approximately 90% of households with single-person and married couples only have their own homes, but about 40% of single-person and couples are more than the guidance living standard in rented homes. . (Fig.3-7-4).
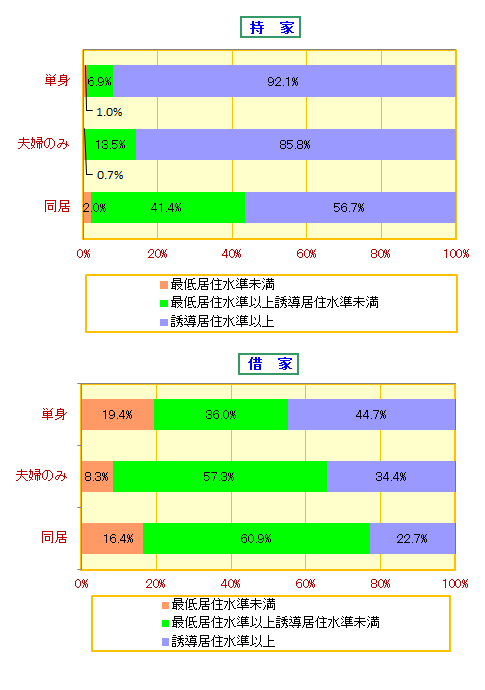
Figure 3-7-4 Living standard of households with elderly people (Yokohama City)
Materials: Ministry of Internal Affairs and Communications, “2018 Housing and Land Statistics Survey”
Income status of elderly households
The annual income of elderly households is lower than the city as a whole, with 51.8% of single-person households and 45.5% of rented houses accounting for less than 3 million yen. For couples-only households, the percentage of less than 3 million yen is 31.7% for owned households and 60.9% for rented households, and the income of rented households is low (Figure 3-7-5).
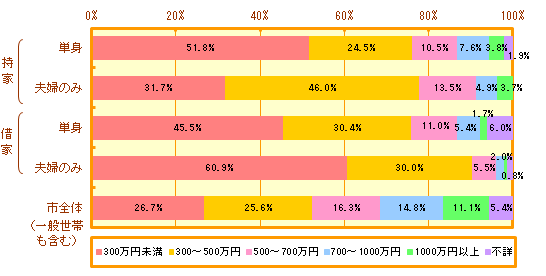
Figure 3-7-5 Income Status of Elderly Households (Yokohama City)
Materials: Ministry of Internal Affairs and Communications, “2018 Housing and Land Statistics Survey”
Rent per month for elderly households living in rented houses
The monthly rent for elderly households living in rented houses is lower than the rent for single-person households and couples only, and about 30% of households are less than 40,000 yen (Figure 3-7-6).
Since low-income tenants are considered to live in low-rent rented houses, care must be taken so that elderly people living in rented houses can live with peace of mind in a better environment.
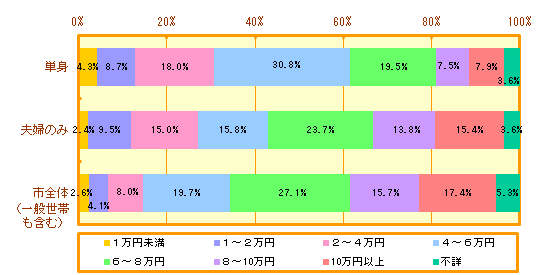
Figure 3-7-6 Rent per month for elderly households living in rented houses (Yokohama City)
Materials: Ministry of Internal Affairs and Communications, “2018 Housing and Land Statistics Survey”
Number of elderly households by location where children live
Looking at the places where children in elderly households live, the percentage of elderly households with children living within a 5-minute walk is 7.9% for single-person households and 9.6% for couples only.
The percentage of households with children living in places less than one hour each way is 34.2% for single-person households and 37.6% for married couples alone. It is likely that the need to deal with care issues when needed will increase. (Fig.3-7-8).
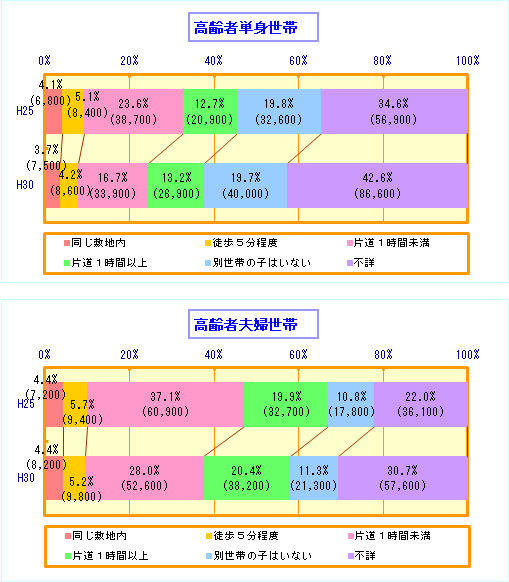
Figure 3-7-8 Number of elderly households by location where children live (Yokohama City)
Materials: Ministry of Internal Affairs and Communications “Housing and Land Statistics Survey 2013/30”
Percentage of renovation work in response to aging by equipment status in owned households
The necessity of housing that responds to aging is emphasized, but about 10% of the 975,400 households have been renovating housing for aging in the last five years. .
In the last five years, about 17% of households with elderly people have been making some barrier-free. While relatively many houses have constructed bathrooms and toilets, the reality is that there are few houses that have eliminated steps. (Fig.3-7-10).
In order to support the independent living of the elderly, it is desirable to promote housing development in response to aging when acquiring or improving housing before becoming an elderly person.
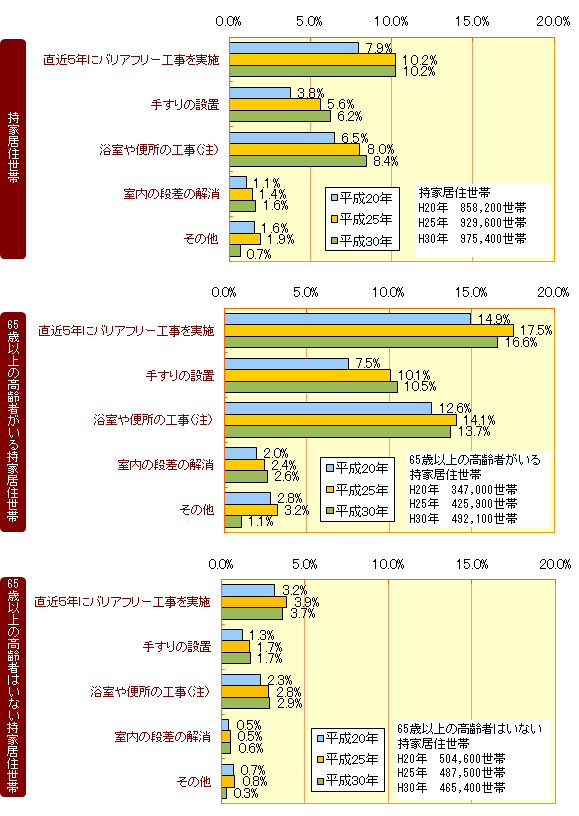
Fig. 3-7-10 Ratio of renovation work for aging by equipment status in households owned by households (Yokohama City)
Materials: Ministry of Internal Affairs and Communications, “Heisei 20, 25, and 30 Housing and Land Statistics Survey”
Construction of bathrooms and toilets (Note)…Total value of bathroom construction and toilet construction
Inquiries to this page
Housing Policy Division, Building Bureau Housing Department
Telephone: 045-671-3975
Telephone: 045-671-3975
Fax: 045-641-2756
Email address: kc-jutakuseisaku@city.yokohama.lg.jp
Page ID: 426-803-879


