- Yokohama-shi Top Page
- Living and Procedures
- Housing and Living
- Housing
- Planning, council, statistical data, etc. related to housing
- Housing-related statistical data
- Housing conditions 3-4: Situation of Relocation
Here's the text.
Housing conditions 3-4: Situation of Relocation
Last Updated January 14, 2022
Status of relocation of households that have moved into their current residence since 2014
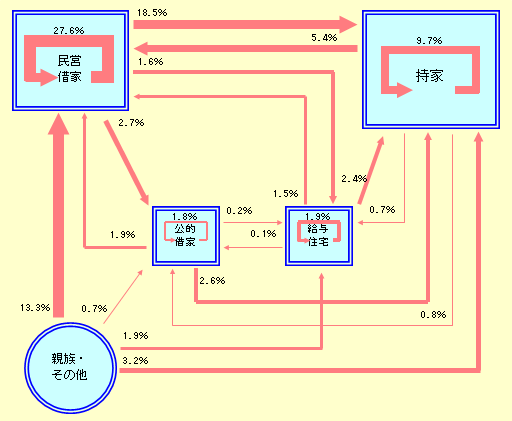
The number of main households relocated to their current address since 2014 was 271,400, accounting for about 16% of the total of 1,649,000 households.
Relocation to private rented houses accounts for about 50% of the main households that have been relocated, and the proportion of private rented houses in relocation is large. Of these, relocation from private rented houses is the largest at 27.6%, followed by relocation from relatives, etc., accounting for 13.3% due to separation of households.
In addition, about 40% of the relocation to own homes, in particular, the number of relocations from private-sector rented homes increased from 17.1% as of 2013 (2013) to 18.5% (Figure 3-4-1).

Figure 3-4-1 Status of relocation of households that have moved into their current residence since 2014 (Yokohama City)
Materials: Ministry of Internal Affairs and Communications “2018 (Heisei 30) Housing and Land Statistics Survey”
Percentage of households that moved into their current residence after 2014, the former Address area was also in the city.
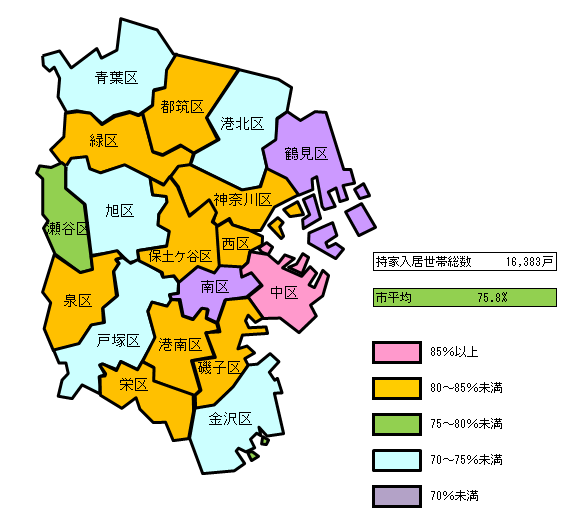
Of the households that moved in after 2014 (Heisei 26), 75.8% of the households whose former residence is in Yokohama City account for 75.8%, and the proportion of relocation in the city is increasing. This trend is similar to that of 2013 (75.8%) at the time of the previous survey.
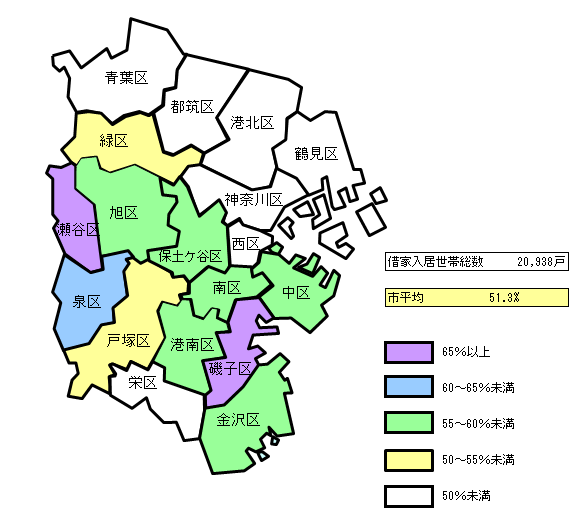
On the other hand, among rented households that moved in after 2014 (Heisei 26), 51.3% of households whose former residence was in Yokohama City, and the ratio of relocation from outside the city is higher than their own homes. I am. This is also almost the same as the previous survey (53.9%).
By distinction, in Naka Ward, the percentage of former residences in Yokohama is particularly large, while in Tsurumi Ward and Minami Ward, it is less than 70%.
In rented houses, the percentage of former residences in Seya Ward is greater in Yokohama.
On the other hand, in northern wards and Sakae Ward, the percentage of former residences outside the city is higher (Fig.3-4-2, Fig.3-4-3).

Fig. 3-4-2 Percentage of households that moved into the current residence since 2014, the percentage of households that were also in the former Address area.
Materials: Ministry of Internal Affairs and Communications “2018 (Heisei 30) Housing and Land Statistics Survey”

Fig. 3-4-3 Percentage of the rented households that moved into the current residence since 2014, the former Address area was also in the city.
Materials: Ministry of Internal Affairs and Communications “2018 (Heisei 30) Housing and Land Statistics Survey”
Figure 3-4-2 Detailed Data
City ratio of former residence of rented households moved in after 2014 (2018) (CSV: 1KB)
Figure 3-4-3 Detailed Data
Inquiries to this page
Housing Policy Division, Building Bureau Housing Department
Telephone: 045-671-3975
Telephone: 045-671-3975
Fax: 045-641-2756
Email address: kc-jutakuseisaku@city.yokohama.lg.jp
Page ID: 955-801-082


