


- Yokohama-shi Top Page
- Living and Procedures
- Housing and Living
- Housing
- Planning, council, statistical data, etc. related to housing
- Housing-related statistical data
- Housing conditions 3-3: Situation of owned houses and rented houses
Here's the text.
Housing conditions 3-3: Situation of owned houses and rented houses
Last Updated January 7, 2022
Changes in the percentage of housing by ownership
In 2018, approximately 59% of households owned by residential households were owned by households.
On the other hand, the ratio of private-sector leased houses was about 30% in 2018. (Fig.3-3-1).
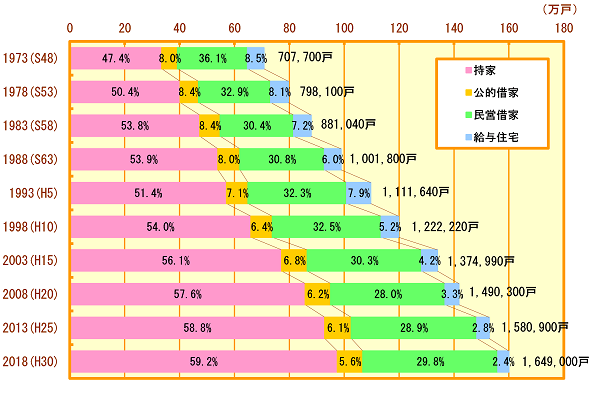
Figure 3-3-1 Changes in proportion of housing by ownership (Yokohama City)
Materials: Ministry of Internal Affairs and Communications, “1973 (Showa 48)-1993 (Heisei 5) Housing Statistics Survey”, “1998 (Heisei 10)-2018 (Heisei 30) Housing and Land Statistics Survey”
Changes in the number of houses by construction period and ownership relationship
Looking at the ratio of ownership of houses by construction period, owners generally account for around 60%. (Figure 3-3-2)
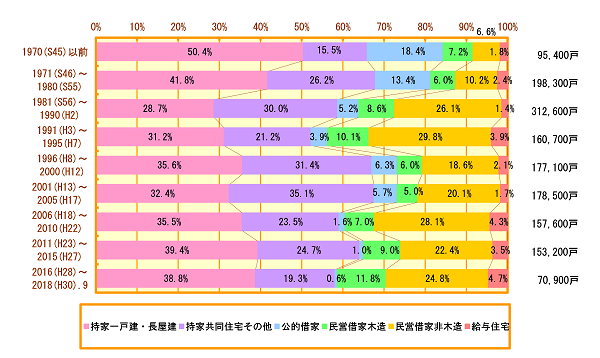
Figure 3-3-2 Changes in the number of houses by building period and ownership relationship (Yokohama City)
Materials: Ministry of Internal Affairs and Communications “2018 (Heisei 30) Housing and Land Statistics Survey”
Percentage of exclusive housing by ownership relationship and by construction time
Looking at a single-family house by construction period, more than 24% of houses were built before 1980 (Showa 55).
In addition, in condominiums (owned houses and non-wooden apartments with three stories or more), the largest percentage is houses built from 1981 (Showa 56) to 1990 (Heisei 2).
(Figure 3-3-3)
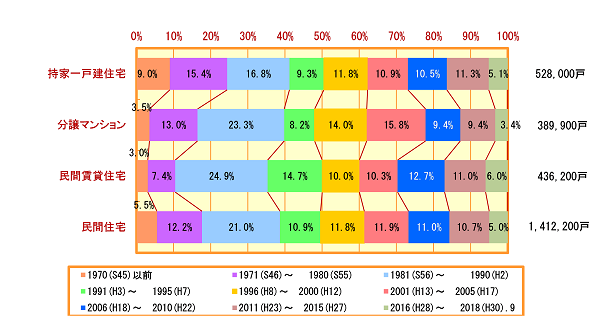
Figure 3-3-3 Percentage of exclusive housing by ownership and building period (Yokohama City)
Materials: Ministry of Internal Affairs and Communications “2018 (Heisei 30) Housing and Land Statistics Survey”
※Private housing refers to housing excluding public rented houses and the number of rented houses of public corporations and public corporations from the total number of dedicated housing.
※Condominiums: Apartment house owned by a non-wooden 3 stories or more
Ownership ratio of each ward
Hodogaya Ward, Isogo Ward, Kanazawa Ward, Totsuka Ward, Konan Ward, Asahi Ward, Sakae Ward, Izumi Ward and Aoba Ward have more than 60% of their homes.
On the other hand, the ownership rate in Kanagawa Ward is less than 50% (Fig.3-3-4).
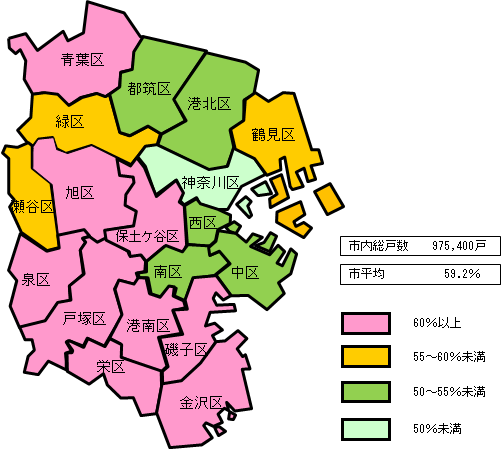
Figure 3-3-4 Ownership ratio of each ward
Materials: Ministry of Internal Affairs and Communications “2018 (Heisei 30) Housing and Land Statistics Survey”
Percentage of household heads by age-related ownership
Looking at the ratio of the number of homes owned by the head of household by age, it rises as the age increases, and about 80% of households live in their homes when they are over 65 years old.
Private rented houses are under the age of 30 and account for about 80%, and private rented houses account for about 60% in their 30s.
About 13% of households 65 years of age or older live in private rented houses, and in light of the increase in the number of elderly households, there is a need to promote barrier-free not only in their own homes but also in rented houses (Figure 3-3-5).
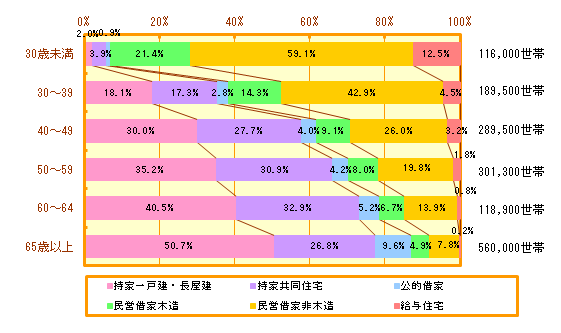
Figure 3-3-5 Percentage of household heads by age and ownership relationship (Yokohama City)
Materials: Ministry of Internal Affairs and Communications “2018 (Heisei 30) Housing and Land Statistics Survey”
Average rent per 1m2 by ownership of leased house
The average rent per 1m2 of rented houses was 2,925 yen for private rented houses (non-wooden), 2,444 yen for private rented houses (wooden), 2,600 yen for public and public corporations, and 1,026 yen for public rented houses. It has become.
Private rental housing has been on a downward trend since 2008 (Figure 3-3-7).
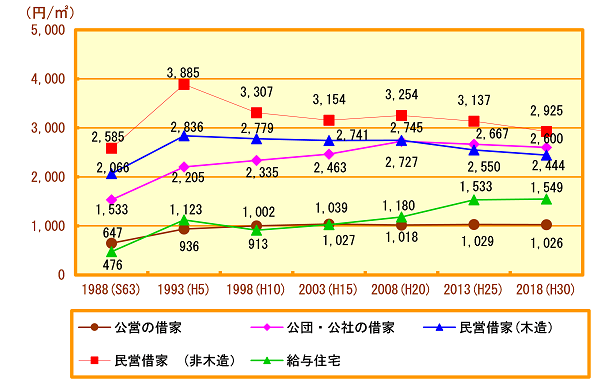
Figure 3-3-6 Changes in Average rent per square meter by ownership of leased houses (Yokohama City)
Materials: Ministry of Internal Affairs and Communications, “1988 (Showa 63)-1993 (Heisei 5) Housing Statistics Survey”, “1998 (Heisei 10)-2018 (Heisei 30) Housing and Land Statistics Survey”
※Includes management fee utility fee.
Average rent per month for rent in each ward
The average rent for rented houses per month was 72,314 yen as of 2013 at the time of the previous survey, but it was 71,423 yen in 2018 (Heisei 30).
The monthly rent is 98,022 yen in Tsuzuki Ward and the lowest is 56,572 yen in Seya Ward (Fig.3-3-7).
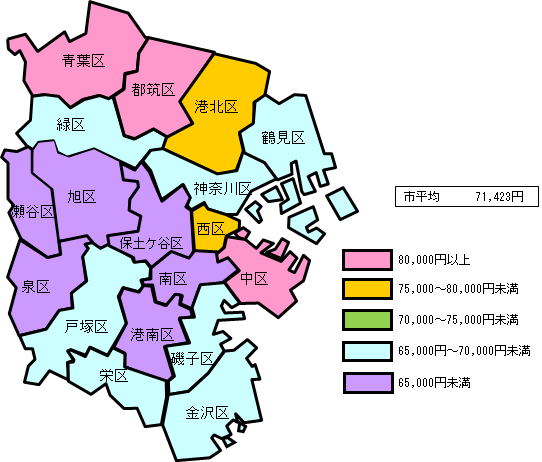
Figure 3-3-7 Average rent per month for rented houses in each ward
Materials: Ministry of Internal Affairs and Communications “2018 (Heisei 30) Housing and Land Statistics Survey”
Inquiries to this page
Housing Policy Division, Building Bureau Housing Department
Telephone: 045-671-3975
Telephone: 045-671-3975
Fax: 045-641-2756
Email address: kc-jutakuseisaku@city.yokohama.lg.jp
Page ID: 551-726-079


