


- Yokohama-shi Top Page
- Living and Procedures
- Housing and Living
- Housing
- Planning, council, statistical data, etc. related to housing
- Housing-related statistical data
- Housing Conditions 2-1: Trends in Housing Startup
Here's the text.
Housing Conditions 2-1: Trends in Housing Startup
Last Updated December 9, 2022
Number of Housing Started in Yokohama City
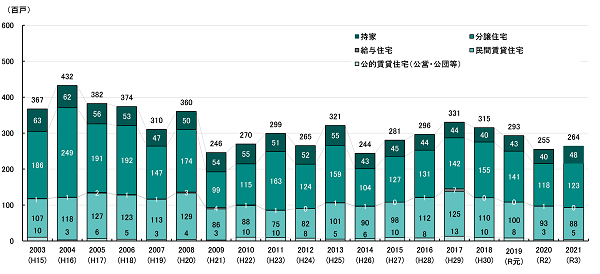
Figure 2-1-1 Changes in the number of housing starts in Yokohama City
The number of housing starts was 54,830 in 1989, but since then it has been on a downward trend with repeated increases and decreases.
In recent years, it has been decreasing since 2017 (Heisei 29), and in 2021 (Reiwa 3), it was 26,391 units.
The number of condominiums has been increasing and decreasing repeatedly, but has been decreasing since 2017 (Heisei 29), with 12,301 units in 2021 (Reiwa 3).
private rental housing has been on a downward trend since 2017, with 8,845 units in 2021 (Reiwa 3) (Fig.2-1-1).
Materials: Ministry of Land, Infrastructure, Transport and Tourism “Housing Statistics”, Policy Bureau, Yokohama City Statistical Report
※Aggregation by year (January to December of each year)
※The Housing Start Statistics are compiled by the Ministry of Land, Infrastructure, Transport and Tourism based on reports from the builder in accordance with the provisions of Article 15, Paragraph 1 of the Building Standards Law.
Changes in the average floor area per house started in Yokohama
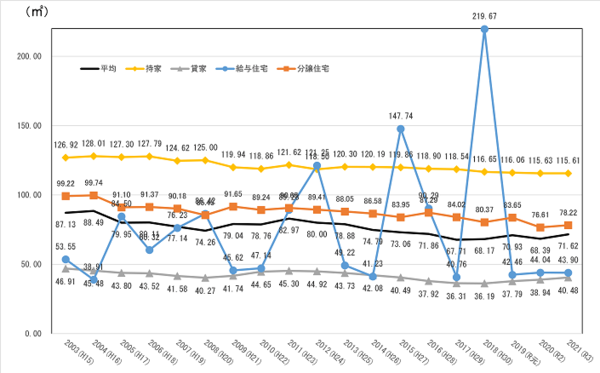
Figure 2-1-3 Changes in the average floor area per house started in Yokohama City
The average floor area of construction started houses had been on an increasing trend until around 2000, but has been on a downward trend in recent years.
The average floor area of a home owned increased to 130.7 m2 in 1998, but in recent years it has fallen below 120 m2.
The average floor area of rented houses increased from 44.4 m2 in 1991 to 62.0 m2 in 1996, but since then it has decreased to 40.48 m2 in 2021 (Rewa 3) (Fig.2-1-3).
Materials: Ministry of Land, Infrastructure, Transport and Tourism “Housing Statistics”, Policy Bureau, Yokohama City Statistical Report
※Aggregation by year (January to December of each year)
※The Housing Start Statistics are compiled by the Ministry of Land, Infrastructure, Transport and Tourism based on reports from the builder in accordance with the provisions of Article 15, Paragraph 1 of the Building Standards Law.
Average floor area per housing starts in each ward
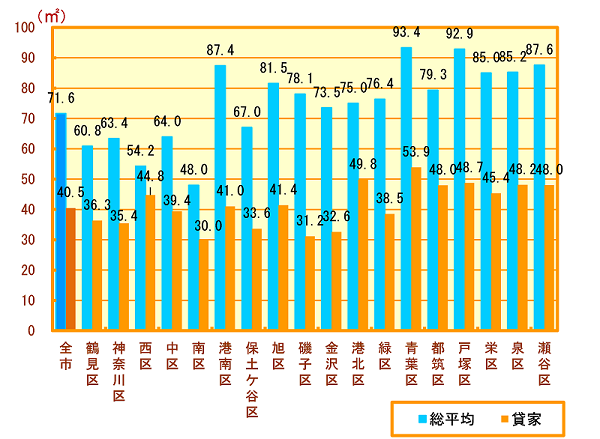
Figure 2-1-4 Average floor area per housing starts in each ward
The average floor area of houses started in 2021 (Reiwa 3) is large in Aoba Ward and Totsuka Ward, while narrow in Nishi Ward and Minami Ward.
In addition, leased houses range from 30 m2 to 50 m2, indicating that demand for housing differs depending on the region (Fig.2-1-4).
Materials: Ministry of Land, Infrastructure, Transport and Tourism “Housing Statistics”, Policy Bureau, Yokohama City Statistical Report
※Aggregation by year (January to December of each year)
※The Housing Start Statistics are compiled by the Ministry of Land, Infrastructure, Transport and Tourism based on reports from the builder in accordance with the provisions of Article 15, Paragraph 1 of the Building Standards Law.
Inquiries to this page
Housing Policy Division, Building Bureau Housing Department
Telephone: 045-671-3975
Telephone: 045-671-3975
Fax: 045-641-2756
Email address: kc-jutakuseisaku@city.yokohama.lg.jp
Page ID: 384-767-013


