


- Yokohama-shi Top Page
- Living and Procedures
- Housing and Living
- Housing
- Planning, council, statistical data, etc. related to housing
- Housing-related statistical data
- Housing conditions 5-1: Citizen's evaluation of housing and living environment
Here's the text.
Housing conditions 5-1: Citizen's evaluation of housing and living environment
Last Updated January 23, 2024
Comprehensive evaluation of housing and living environment
The overall evaluation of housing and living environment gradually increased, and in 2018, the total evaluation of "satisfied" and "well satisfied" was 81.8% (Fig.5-1-1).
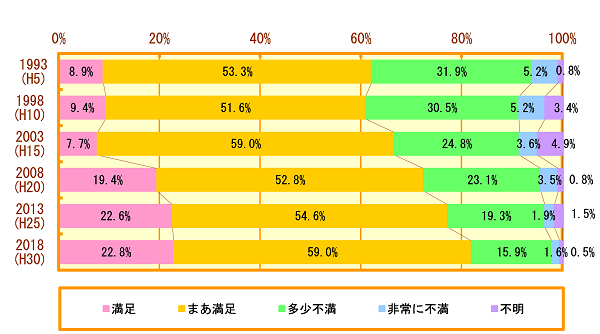
Figure 5-1-1 Comprehensive Evaluation of Housing and Living Environment (Yokohama City)
Materials: Kanagawa Prefecture “1993 (Heisei 5)-2003 (Heisei 15) Survey on Housing Demand in Kanagawa Prefecture” “2008 (Heisei 20)-2018 (Heisei 30) Survey on Housing and Living in Kanagawa Prefecture”
Comprehensive evaluation of housing
Regarding housing, the number of respondents who answered "satisfied" or "well satisfied" continued to increase, reaching 79.5% in 2018 (Figure 5-1-2).
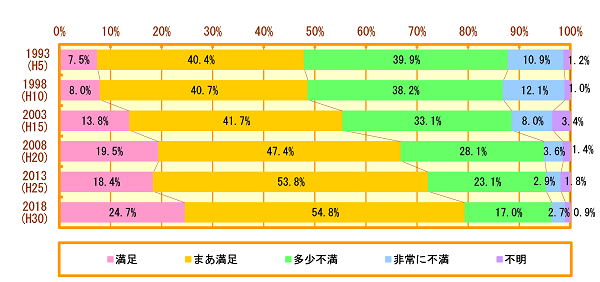
Figure 5-1-2 Comprehensive Evaluation of Housing (Yokohama City)
Materials: Kanagawa Prefecture “1993 (Heisei 5)-2003 (Heisei 15) Survey on Housing Demand in Kanagawa Prefecture” “2008 (Heisei 20)-2018 (Heisei 30) Survey on Housing and Living in Kanagawa Prefecture”
Comprehensive evaluation of living environment
Regarding the living environment, the number of respondents "satisfied" and "slightly satisfied" decreased in 1998, but the number has increased again since 2003, reaching 75.9% in 2018 (Figure 5-1-3).
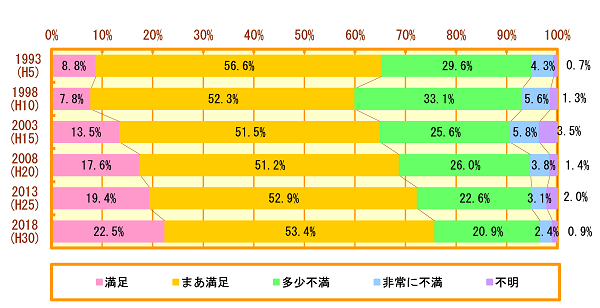
Figure 5-1-3 Comprehensive evaluation of living environment (Yokohama City)
Materials: Kanagawa Prefecture “1993 (Heisei 5)-2003 (Heisei 15) Survey on Housing Demand in Kanagawa Prefecture” “2008 (Heisei 20)-2018 (Heisei 30) Survey on Housing and Living in Kanagawa Prefecture”
Dissatisfaction rate for each element of housing
In a survey on dissatisfaction in each element of housing, the percentage of dissatisfaction overall decreased in 2018 compared to 2013 (Heisei 25), but dissatisfaction with regard to "consideration for the elderly, etc." was as high as about 44% (Figure 5-1-4).
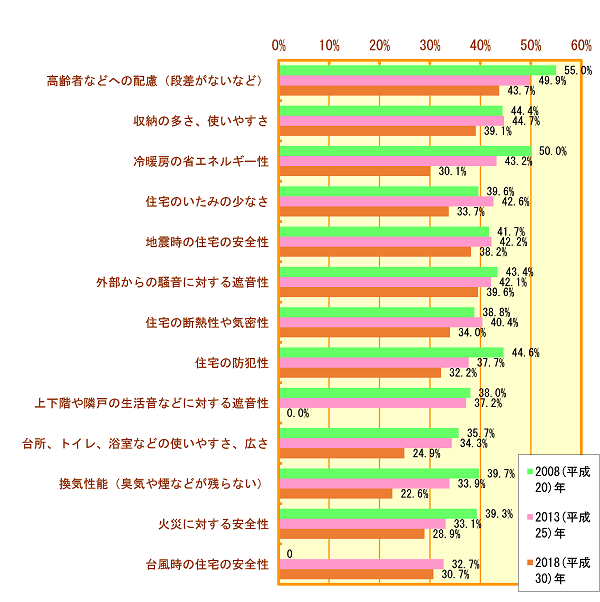
Fig. 5-1-4 Dissatisfaction rate for each element of housing (Yokohama City)
Materials: Kanagawa Prefecture "2008 (Heisei 20)-2018 (Heisei 30) Comprehensive Survey on Housing and Living"
Dissatisfaction rate for each element of the living environment
According to a survey on dissatisfaction in each element of the living environment, the percentage of dissatisfaction overall decreased in 2018 compared to 2013 (Heisei 25), but dissatisfaction with "safety while walking around roads" (38.4%) and "low noise and air pollution" (36.9%) are increasing. (Fig.5-1-5).
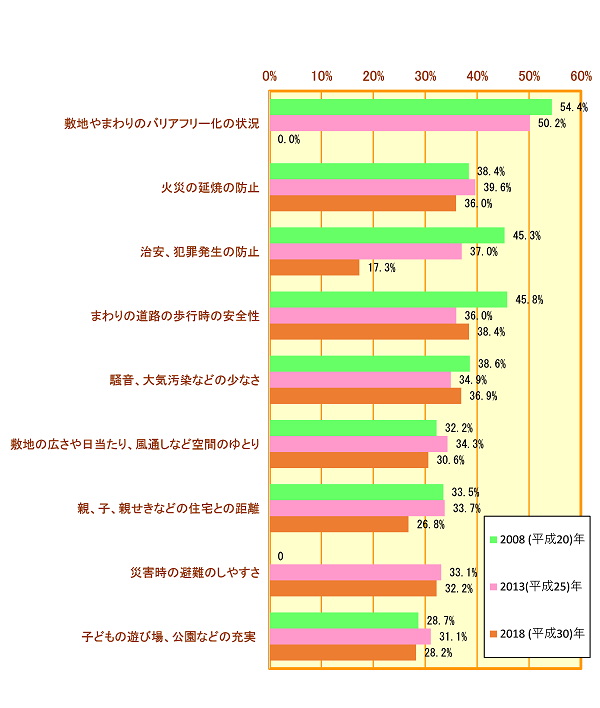
Fig. 5-1-5 Dissatisfaction rate for each element of living environment (Yokohama City)
Materials: Kanagawa Prefecture "2008 (Heisei 20)-2018 (Heisei 30) Comprehensive Survey on Housing and Living"
※Those that are not included in the response items for each survey year are indicated as zero.
Living environment evaluation by public awareness survey (items with higher satisfaction)
Looking at the items with higher satisfaction regarding the life evaluation in the public awareness survey in 2021 (Reiwa 3), "flights such as buses and subways" exceeded the request (23.0%) (23.0%) by 29.4 points higher, the degree of satisfaction is the highest. Next, in "separate collection and recycling of garbage", satisfaction (33.5%) exceeded the request (15.9%) by 17.6 points (Fig.5-1-6).

Figure 5-1-6 Living Environment Assessment (items with higher satisfaction) in public awareness survey
Materials: Policy Bureau, Yokohama City "2021 (Reiwa 3) Yokohama Public Awareness Survey"
Living environment evaluation in public awareness survey (items with higher requests)
On the other hand, looking at items with higher requests, in "disaster countermeasures such as earthquakes", satisfaction (4.0%) is 27.7 points lower than the request (31.7%), and the gap between the two is the largest.
Next, in the anti-crime program Countermeasures, satisfaction (4.8%) was 22.6 points lower than the request (27.4%) (Fig.5-1-7).
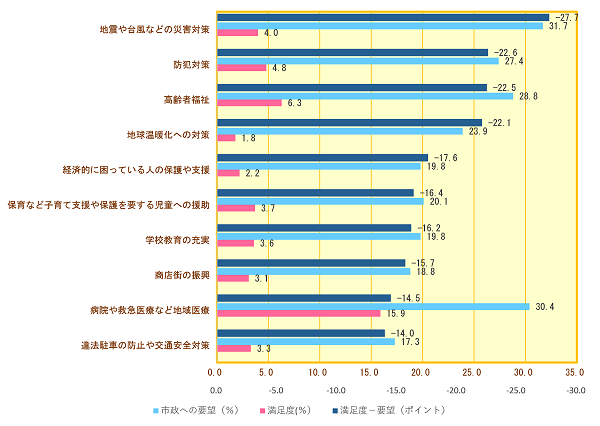
Figure 5-1-7 Living environment evaluation (items with higher demand) in public awareness survey
Materials: Policy Bureau, Yokohama City "2021 (Reiwa 3) Yokohama Public Awareness Survey"
Every worry in life
According to a public awareness survey, "illness and retirement" continue to dominate the number one concern in life, and the proportion has increased in recent years.
In addition, since 2001 (Heisei 13), concerns about "family health, etc." accounted for the second place.
On the other hand, "Housing" was ranked high until 1996, but since 1997, it has been ranked 6th to 9th (Fig.5-1-11).
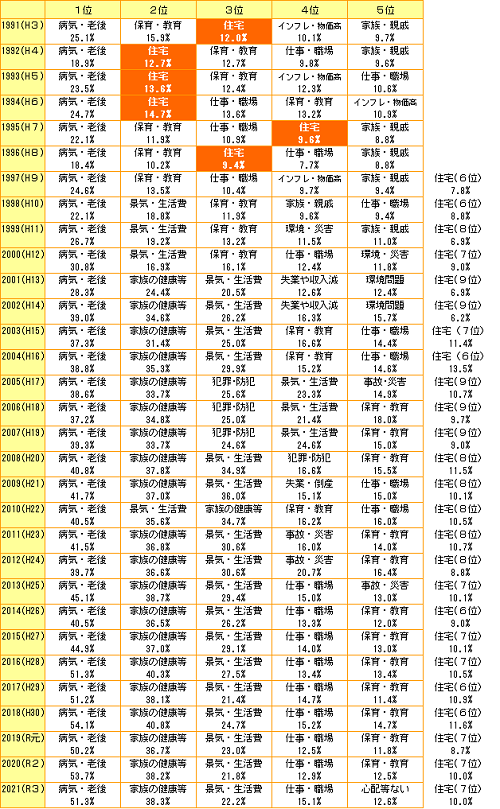
Fig. 5-1-11: Every worry in life
Materials: Policy Bureau, Yokohama Public Awareness Survey
From 1998, "inflation and high prices" became "economic and living expenses."
Since 2001, "Family Problems" have been specifically "Family Health and Life Issues".
"Environmental problems and disasters" were "environmental problems" and "accidents and disasters."
"Criminal and anti-crime program" was established in 2005.
Inquiries to this page
Housing Policy Division, Building Bureau Housing Department
Telephone: 045-671-3975
Telephone: 045-671-3975
Fax: 045-641-2756
Email address: kc-jutakuseisaku@city.yokohama.lg.jp
Page ID: 691-341-931


