


- Yokohama-shi Top Page
- Living and Procedures
- Housing and Living
- Housing
- Planning, council, statistical data, etc. related to housing
- Housing-related statistical data
- Housing conditions 3-2: Status of Residential Areas
Here's the text.
Housing conditions 3-2: Status of Residential Areas
Last Updated September 13, 2024
Changes in total floor area per house in Yokohama City, number of tatami mats per person living room
Both the total area per house and the number of tatami mats per person have continued to increase, and the total area per house in 2018 (Heisei 30) was 95.92 m2 owned houses, 44.44 m2 rented houses, and the number of tatami mats per person living rooms is 14.21 tatami mats and 10.04 tatami mats per rented houses.
However, the gap between the total area of the house and the rented house is still large. (Figure 3-2-1, Fig. 3-2-2)
- Reference Materials[About the size of the house]
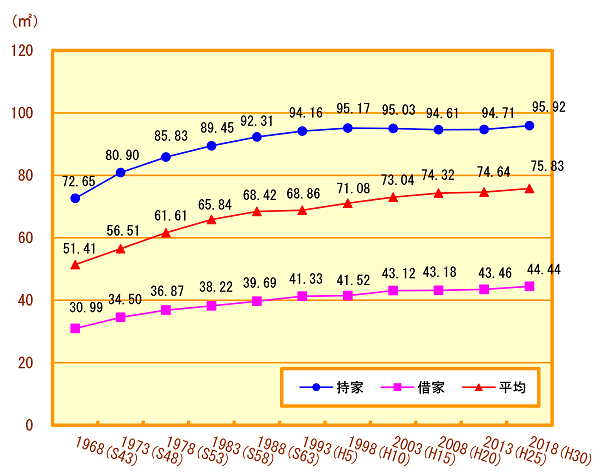
Figure 3-2-1 Changes in total floor area per house in Yokohama City
Materials: Ministry of Internal Affairs and Communications, “1968 (Showa 43)-1993 (Heisei 5) Housing Statistics Survey”, “1998 (Heisei 10)-2018 (Heisei 30) Housing and Land Statistics Survey”
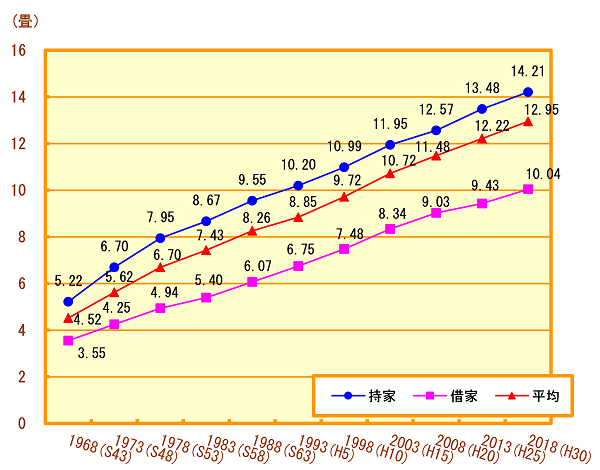
Figure 3-2-2 Changes in the number of tatami mats per person in Yokohama City
Materials: Ministry of Internal Affairs and Communications, “1968 (Showa 43)-1993 (Heisei 5) Housing Statistics Survey”, “1998 (Heisei 10)-2018 (Heisei 30) Housing and Land Statistics Survey”
Total floor area per house in each ward
Seya Ward, Sakae Ward, Izumi Ward, Aoba Ward, Tsuzuki Ward , and Kanagawa Ward and Nishi Ward are more than 90 m2.
In terms of rental housing, Aoba Ward Tsuzuki Ward accounted for more than 50 m2 and Tsurumi Ward Kanagawa Ward Nishi Ward Minami Ward accounted for less than 40 m2 (Fig.3-2-3).
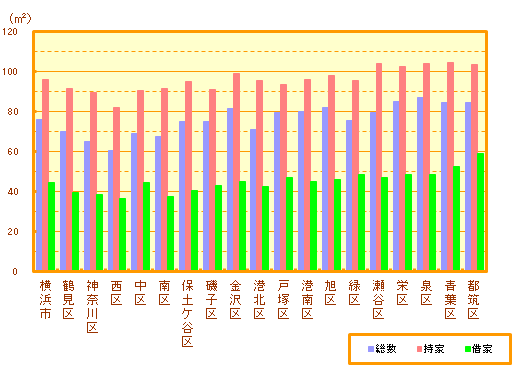
Figure 3-2-3 Total floor area per house in each ward (2018)
Materials: Ministry of Internal Affairs and Communications “2018 (Heisei 30) Housing and Land Statistics Survey”
Changes in the number of houses by site area of detached houses
The average site area of a single-family house was 180 m2 in 1988 (Showa 63), but has been on a downward trend since then, reaching 160 m2 in the 2018 (Heisei 30).
In addition, the site area of 100m2 to 149m2 is the largest, accounting for about 30% (Fig.3-2-4).
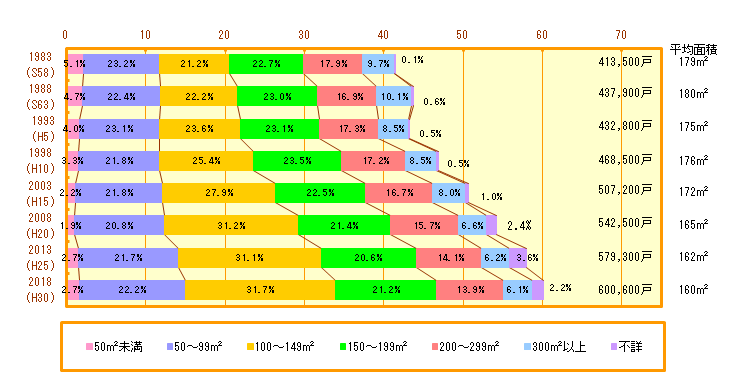
Figure 3-2-4 Changes in the number of houses in single-family homes by site area
Materials: 1968 (Showa 43)-1993 (Heisei 5) Housing Statistics Survey, 1998 (Heisei 10)-2018 (Heisei 30) Housing and Land Statistics Survey
Inquiries to this page
Housing Policy Division, Building Bureau Housing Department
Telephone: 045-671-3975
Telephone: 045-671-3975
Fax: 045-641-2756
Email address: kc-jutakuseisaku@city.yokohama.lg.jp
Page ID: 487-685-874


