


- Yokohama-shi Top Page
- Living and Procedures
- Housing and Living
- Housing
- Planning, council, statistical data, etc. related to housing
- Housing-related statistical data
- Housing conditions 2-2: Recent trends in the housing market
Here's the text.
Housing conditions 2-2: Recent trends in the housing market
Last Updated January 13, 2022
Number of condominium units sold in Yokohama City and area per unit
The number of condominiums sold increased sharply since 1993, and fell once in 1998, to 14,275 units in 2000 (Heisei 12).
However, since then, it has been on a downward trend, and in 2009, it decreased to 2,829 units.
The number has been increasing since 2010 (Heisei 22), but in recent years it has been decreasing again, reaching 2,606 units in 2020 (Reiwa 2).
The average area per unit has been decreasing since peaking at 79.8m2 in 2003, and in recent years it has been in the first half of 70m2, but in 2020 (Reiwa 2), it was 66.3m2 , below 70m2. (Fig. 2-2-1).
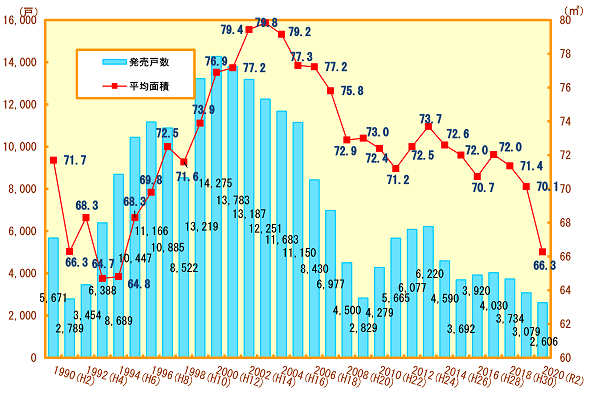
Figure 2-2-1 Graph of the number of units sold in condominiums and area per unit in Yokohama
Materials: Real Estate Economic Research Institute, Inc. “1989-2007 National Condominium Market Trends”
Haseko Research Institute, Ltd. “Metropolitan and Kinki Condominium Market Trends”
Average Price of Condominiums in Yokohama
The average price continued to decline after peaking at 67.93 million yen in 1990, and fell to around 39 million yen in 2000 (Heisei 12) and 2004 (Heisei 16).
However, after that, it turned upward, reaching 64.03 million yen in 2017 (Heisei 29), but the average price of 2020 (Reiwa 2) was 57.65 million yen. (Figure 2-2-2)
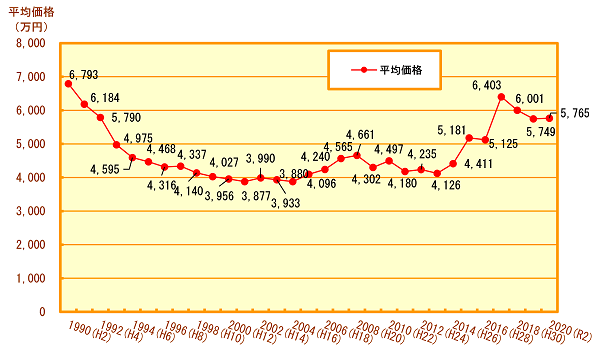
Figure 2-2-2 2 Graph of Average Prices for Condominiums in Yokohama
Materials: Real Estate Economic Research Institute, Inc. “1990-2007 National Condominium Market Trends”
Haseko Research Institute, Ltd. “Metropolitan and Kinki Condominium Market Trends”
Changes in the number of homes acquired in second-hand homes in Yokohama
Since 1992, the number of second-hand homes acquired has remained between 7,000 and 9,000 units.
Of existing homes, the proportion of "condominiums and others" has remained at around 70%. (Fig.2-2-3).
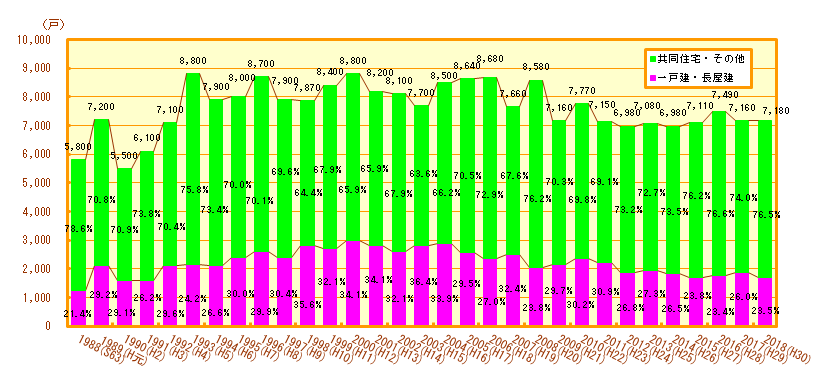
Figure 2-2-3 Changes in the number of second-hand homes acquired in Yokohama City
Materials: Ministry of Internal Affairs and Communications “1988 (Showa 63) ・ 1993 (Heisei 5) Housing Statistics Survey” “1998 (Heisei 10)-2018 (Heisei 30) Housing and Land Statistics Survey”
※In 1988 (Showa 63), 1993 (Heisei 5), 1998 (Heisei 10), 2003 (Heisei 15), 2008 (Heisei 20), 2013 (Heisei 25), and 2018 (Heisei 30), the number of units for the period from January to September is adjusted to September is adjusted to the year.
Trends in Distribution of Existing Housings (Yokohama City)
The ratio of the number of second-hand homes acquired as owners to the total number of housing starts in the city and the number of second-hand homes acquired as owners has increased little by little, and 18.5% in 2018 (Heisei 30). It has become. (Fig.2-2-4).
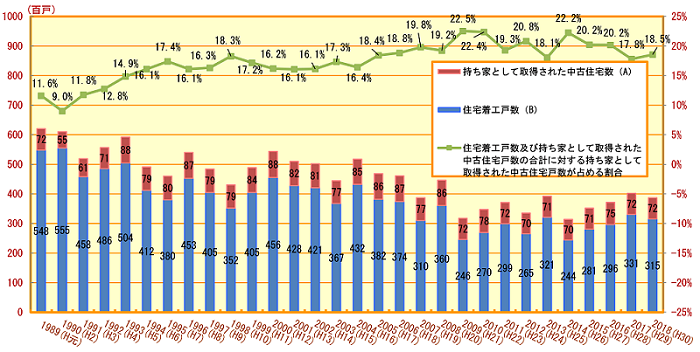
Figure 2-2-4 Changes in the proportion of existing homes acquired as owned homes to total owned homes (Yokohama City)
Materials: Ministry of Internal Affairs and Communications “1988 (Showa 63) ・ 1993 (Heisei 5) Housing Statistics Survey” “1998 (Heisei 10)-2018 (Heisei 30) Housing and Land Statistics Survey”
※In 1988 (Showa 63), 1993 (Heisei 5), 1998 (Heisei 10), 2003 (Heisei 15), 2008 (Heisei 20), 2013 (Heisei 25), and 2018 (Heisei 30), the number of units for the period from January to September is adjusted to September is adjusted to the year.
Changes in percentages by housing acquisition method
From 2014 (Heisei 26) to September 2018 (Heisei 30), a total of 78,200 units were acquired.
Among them, 84.5% of sales, new construction, and second-hand homes have consistently accounted for more than 80% since 1999. (Figure 2-2-5).
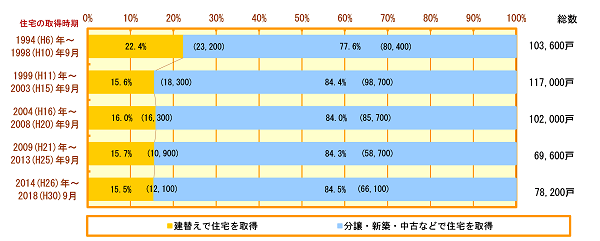
Figure 2-2-5 Changes in Ratios by Housing Acquisition Method (Yokohama City)
Materials: Ministry of Internal Affairs and Communications “1988 (Showa 63) ・ 1993 (Heisei 5) Housing Statistics Survey” “1998 (Heisei 10)-2018 (Heisei 30) Housing and Land Statistics Survey”
Intention to renovation and rebuilding of the current home in the future or future
Regarding the intention to renovate or rebuild a home, "I do not think any of them", 23.7% of respondents are thinking about renovation, and 1.6% are thinking about rebuilding.
(Fig.2-2-6).
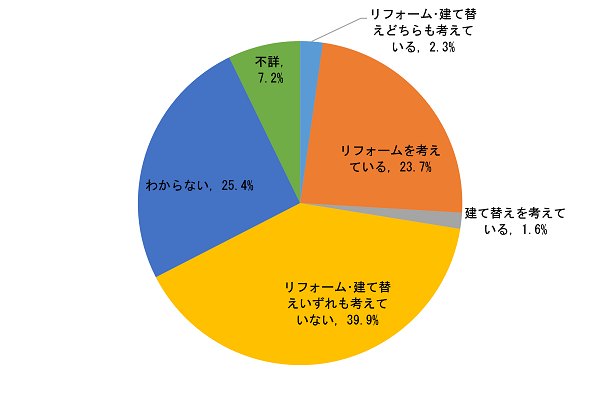
Figure 2-2-6 Percentage of housing improvement plans for own homes (Yokohama City)
Materials: Ministry of Land, Infrastructure, Transport and Tourism “2018 (Heisei 30) Comprehensive Survey on Housing and Living”
Purpose of renovation and rebuilding
If you are considering renovation or rebuilding in the future, the purpose is to "clean (remediate damage)" with the highest 75.3%. "Improvement of performance", which enhances heat insulation and energy saving, has been selected for a certain purpose at 26.3%. (Fig.2-2-7).
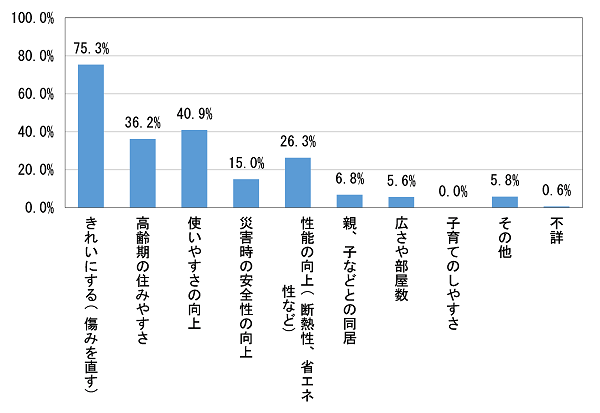
Figure 2-2-7 Renovation and Rebuilding Enome-like (Yokohama City)
Materials: Ministry of Land, Infrastructure, Transport and Tourism “2018 (Heisei 30) Comprehensive Survey on Housing and Living”
Reform and Rebuilding Issues
As an issue for renovation and rebuilding, "lack of funds and income" accounts for about 50%. (Fig.2-2-8).
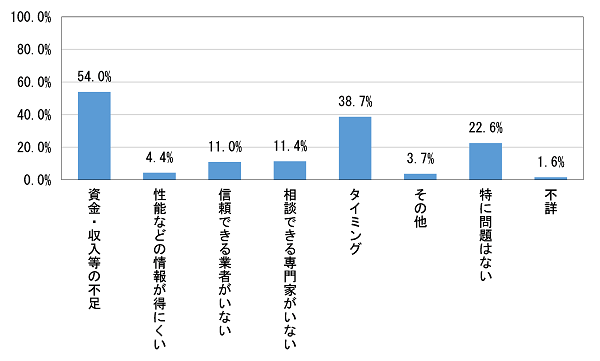
Figure 2-2-8 Refurbishment and Rebuilding Issues (Yokohama City)
Materials: Ministry of Land, Infrastructure, Transport and Tourism “2018 (Heisei 30) Comprehensive Survey on Housing and Living”
Period of renovation and rebuilding
About 40% of the respondents expect renovations and rebuildings to be carried out within five years. Many of us have been thinking about 5 years from now on. (Figure 2-2-9).
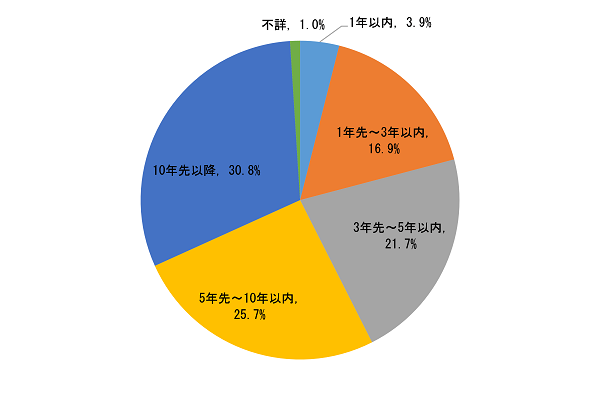
Figure 2-2-9 Date of renovation and rebuilding (Yokohama City)
Materials: Ministry of Land, Infrastructure, Transport and Tourism “2018 (Heisei 30) Comprehensive Survey on Housing and Living”
Inquiries to this page
Housing Policy Division, Building Bureau Housing Department
Telephone: 045-671-3975
Telephone: 045-671-3975
Fax: 045-641-2756
Email address: kc-jutakuseisaku@city.yokohama.lg.jp
Page ID: 915-363-438


