


- Yokohama-shi Top Page
- Living and Procedures
- Housing and Living
- Housing
- Planning, council, statistical data, etc. related to housing
- Housing-related statistical data
- Housing conditions 1-3: Situation of Urbanization
Here's the text.
Housing conditions 1-3: Situation of Urbanization
Last Updated December 28, 2021
Trends in Population Concentration Areas in Yokohama City
The area of the population concentration area (*) in Yokohama City occupied 24.6% of the city area in 1960 (Showa 35), but it was 80.5% in 2020 (Reiwa 2), and urbanization is progressing (Figure 1-3-1).
※Population-intensive district…Japanese translation of Densely Inhabited District. An urban area set by the census, which refers to an area with a population density of 4,000 or more per square kilometer adjacent to each other within the boundaries of municipalities and has a population of 5,000 or more. Population-intensive districts are generally used in urban planning administration as a concept of urban areas.
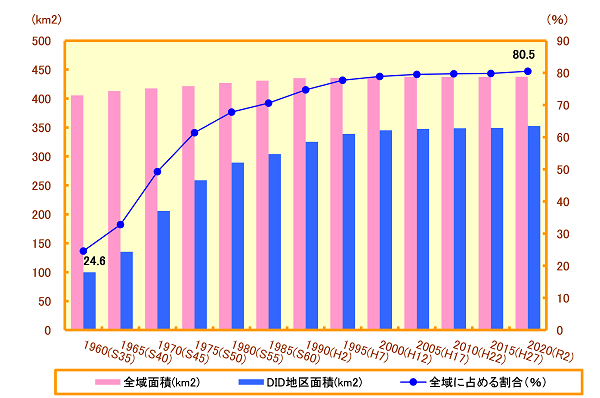
Figure 1-3-1 Trends in Population Concentrated Areas in Yokohama City
Materials: Ministry of Internal Affairs and Communications "1960 (Showa 35)-2020 (Reiwa 2) Census"
Land area and percentage of Yokohama City by land type
Looking at changes in land use, the ratio of residential land is increasing. In 1960 (Showa 35), the ratio of residential land was 21.4%, but in 2021 (Reiwa 3), it accounted for 74.8%, and from 72.4% in 2011 (Heisei 23), 10 years ago, residential land conversion is progressing.
Meanwhile, agricultural land decreased from 41.2% to 10.4%, and forest and wilderness decreased from 36.3% to 6.6% during the same period (Fig.1-3-2).

Fig. 1-3-2 Figure of land area and ratio by land type in Yokohama City
Materials: Policy Bureau, Yokohama City Statistical Report
Inquiries to this page
Housing Policy Division, Building Bureau Housing Department
Telephone: 045-671-3975
Telephone: 045-671-3975
Fax: 045-641-2756
Email address: kc-jutakuseisaku@city.yokohama.lg.jp
Page ID: 305-162-674


