


- Yokohama-shi Top Page
- Living and Procedures
- Housing and Living
- Waste and recycling
- Data, pamphlets and sound sources
- Data
- Garbage composition survey
Here's the text.
Garbage composition survey
Let's take a look at the contents of garbage from home
Last Updated September 5, 2024
In Yokohama-shi, we carry out "garbage composition investigation" to examine the separation situation of garbage coming out of home and the situation of Yokohama Pla 5.3 plan.
The contents of burnable garbage
Although the proportion of recyclables in burnable garbage decreased significantly after the expansion of items collected separately, there are still many items such as recycle paper and plastic containers and packaging.
According to a 2023 survey, recycle paper accounts for about 10% of burnable garbage and plastic containers and packaging accounts for about 6%.
In order to promote the separation and recycling of garbage, please continue to cooperate with the separation, referring to "How to separate and dispose of garbage and resources".
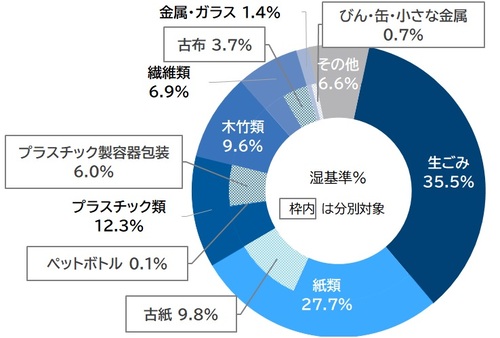
Figure 1 Contents of burnable garbage from Homes (FY2023 Survey Results)
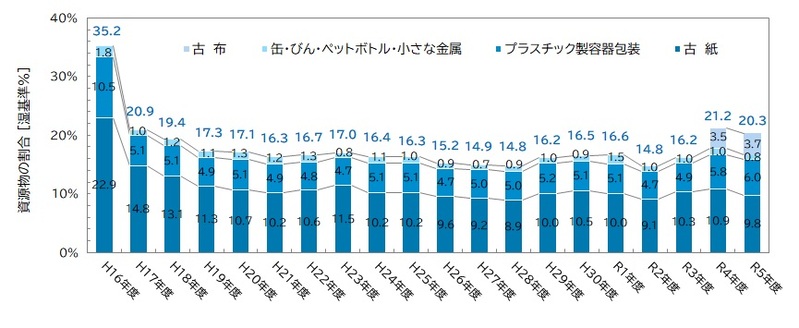
Figure 2 Changes in the proportion of recyclables in burnable garbage
Note 1: In fiscal 2004, the percentage of the previous fiscal year prior to the expansion of separate collection items is shown.
(Separated collection items expanded in some wards from the second half of 2004 and in all cities from 2005)
Note 2: In fiscal 2022, we began a survey of used cloth.
Examples of items collected separately in burnable garbage
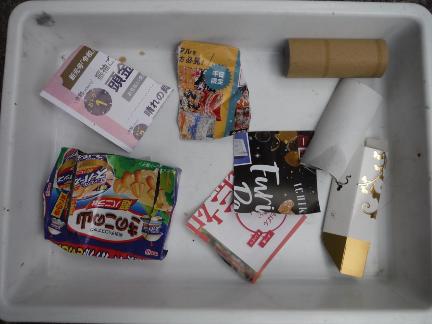 recycle paper
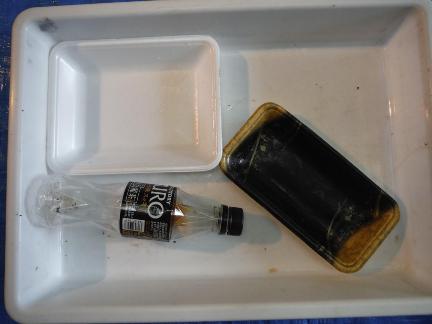 Food trays, PET bottles
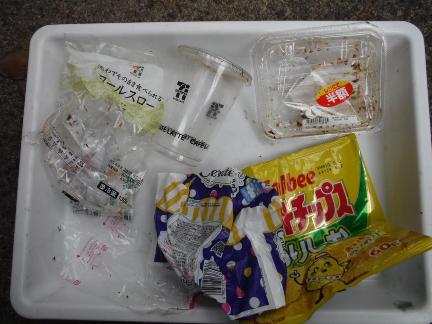 Plastic containers and packaging for food and other products
 Plastic containers and packaging for food and other products
Percentage of PET bottle discharge
About 67% of PET bottles that were properly sorted out by removing the lid and label (Figure 3).
(1) Empty the inside and wash (2) Remove the cap and label and crush (3) crush it (for details, see "Can / Bottle / PET bottle").
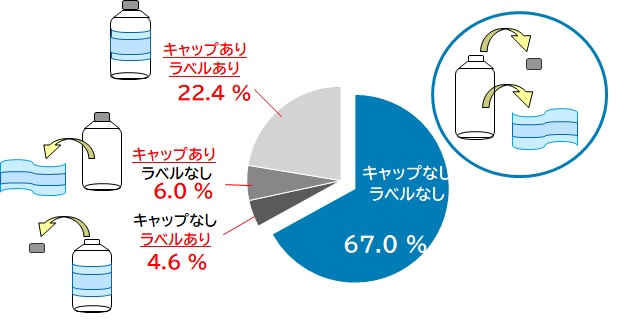
Figure 3 Emissions of PET bottles issued as recyclables (FY2023 Survey Results)
Percentage of recyclables (separation cooperation rate)
About 60% of plastic containers and packaging were correctly sorted as recyclables, and about 40% were mixed in burnable garbage.
In addition, almost 97% of bottles, cans, and PET bottles were properly sorted (Fig. 4).
We look forward to your continued cooperation in sorting, referring to "How to separate and dispose of garbage and resources".
In particular, we ask for your cooperation in correct sorting for plastic containers and packaging.

Figure 4 Separation Cooperation Rate of Recyclables (FY2023 Survey Results)
The contents of kitchen garbage included in burnable garbage
Of the kitchen garbage contained in the burnable garbage, food loss accounted for about half of the food loss in “untouched food (food that is thrown away without hand)”, “leftover food” and “excessive removal of unedible parts such as vegetable skins” (Figure 5).
In addition, about the amount of food loss generated in 2023, please see "about food loss generated from home".

Figure 5 The contents of kitchen garbage published in burnable garbage (FY2023 survey results)
Examples of food loss from burnable garbage
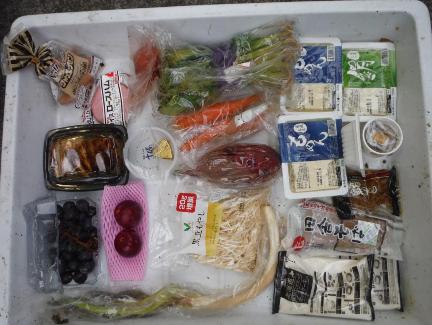 Untouched food (food, etc.)
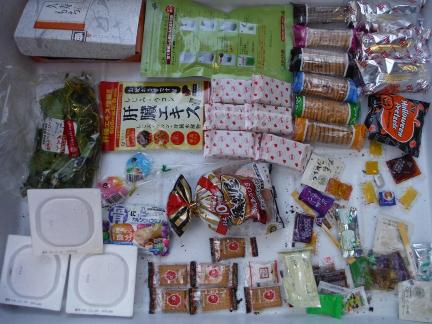 Untouched foods (confectionery, etc.)
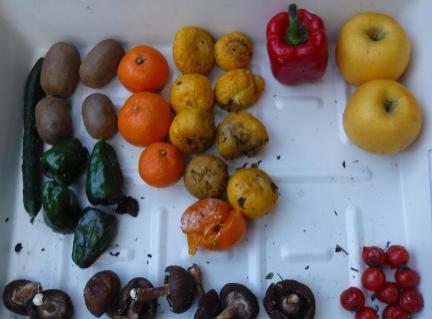 Untouched food (fruits, etc.)
 Untouched food (vegetables, etc.)
The contents of plastics contained in burnable garbage
About 68% of the plastics contained in burnable garbage were "One-way plastic (Note 5)" (blue portion of the outer circle in Figure 6).
Excluding garbage bags, the reduction of one-way plastic was about 52% (red part of the inner circle in Figure 6).
We will continue to separate garbage, and please receive disposable cutlery as much as you need and cooperate with the use of My Bags and My Bottles.
Note 5: It is made of plastic and usually finishes its role after using it.
Example: Plastic containers and packaging, plastic bottles such as beverages and seasonings, plastic tableware such as straws and spoons, etc.
Since there is no specific example of what corresponds to one-way plastic, we have created and investigated our own classification standards in Yokohama City.
| Item name | Main objects |
|---|---|
One-way plastic | Disposable straws, spoons, madlers, clear cups, etc. |
One-way plastic | Wraps, disposable gloves, zip locks, plastic bags (excluding those used as garbage bags), etc. |
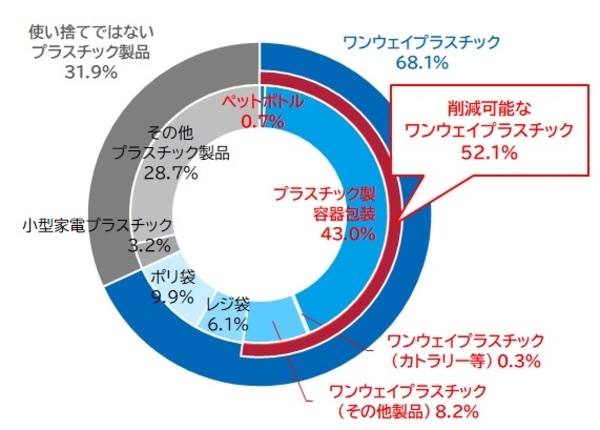
Figure 6 Contents of Plastics in burnable garbage (FY2023 Survey Results)
※Shopping bags and plastic bags are intended for those used as garbage bags.
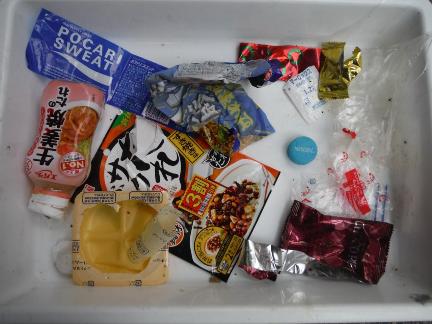
Example of one-way plastic from burnable garbage
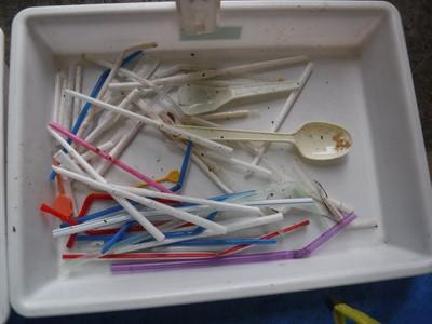 One-way plastic (tableware, etc.)
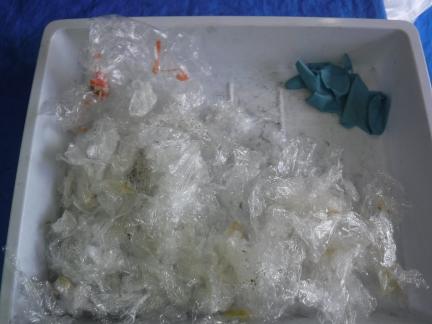 One-way plastic (other products)
Data
Garbage composition findings (from 2019 to 2023) (Excel: 15KB)
Changes in Separation Cooperation Rate (from FY2019 to FY2023) (Excel: 12KB)
Inquiries to this page
Policy Coordination Division, Policy Coordination Division, Resources and Waste Recycling Bureau Policy Coordination Department
Telephone: 045-671-4565
Telephone: 045-671-4565
Fax: 045-550-4239
Email address: sj-chousa@city.yokohama.jp
Page ID: 667-929-526


