


- Yokohama-shi Top Page
- Living and Procedures
- Community Development and Environment
- Environmental Conservation
- Survey and observation
- Environment Environmental Pollution Monitoring Center
- Reference information
- Explanation of constant monitoring telemeter system
Here's the text.
Explanation of constant monitoring telemeter system
Last update date April 1, 2024
1.Introduction
Environmental Environmental Pollution Monitoring Center measures the air environment at elementary and junior high schools and ward offices and the discharge of pollutants from large-scale source factories 24 hours a day.
These measurement data are monitored using a constant monitoring telemeter system.
In this page, we will explain the outline of Yokohama's constant monitoring telemeter system, the equipment used, and the concept of system design.
Structure of the constant monitoring telemeter system
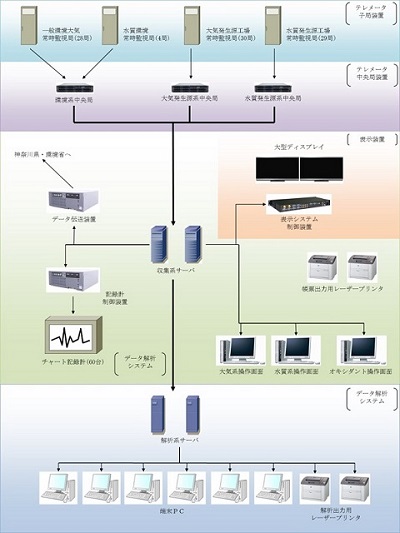
The system diagram of the constant monitoring telemeter system is shown below.
This system consists of a measurement station data collection system that collects measurement data from measurement stations, and a control, monitoring, analysis, and reporting output system that controls and outputs measurement data from measurement stations.
The "Measurement station data collection system" is composed of slave station equipment, central station equipment, recorders, etc. installed at measurement stations around the city, and stores measurement data collected by slave station equipment in a database.
The "control, monitoring, analysis, and report output system" grasps and controls the operation status of measuring machines, etc., performs computer processing measurement data collected from various parts of the city, and outputs forms.
The current status of the atmospheric environment is published on the homepage of Motoichi and on the homepage of Kanagawa Prefecture.
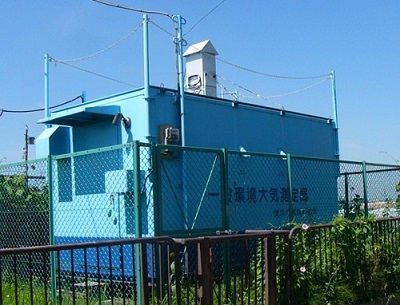
General Atmospheric Monitoring Station
Continuous measurement of the general atmospheric environment is conducted at the General Environmental Air Measurement Bureau (20 stations) installed in residential areas in the city and the Automobile Exhaust Gas Measurement Bureau (8 stations) installed along the main road. We measure the concentration of pollutants.
At the same time, weather data such as wind direction and wind speed are also measured at the same time to understand fluctuations in environmental concentration.
Continuous monitoring of atmospheric sources is intended for large-scale fixed sources (30 factories in the city). The target factories measure fuel consumption and emission levels of nitrogen oxides and sulfur oxides in flueways.
2.Major Functions of Measurement Station Data Collection System
Data collection in slave station equipment
The connection diagram around the slave station equipment is shown below.
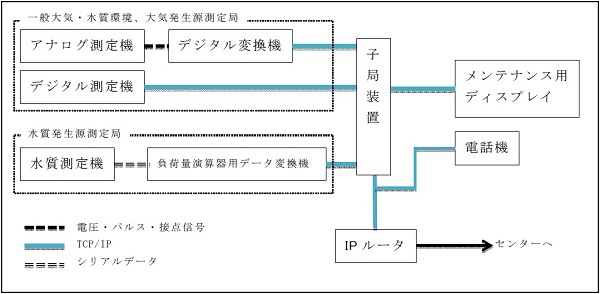
The slave station equipment installed at the general atmospheric environment, air source, and water quality source measurement stations installed in various parts of the city obtains the measured values from the measuring machines (sulfur oxides, oxidants, etc.) installed at the measurement station. To do. However, in the case of a source measurement station, the measurement value data provided by the business operator is obtained. This data acquisition is performed periodically (per minute) automatically and is sent to the central station equipment in response to the data request signal from the central station. If the measuring machine installed at the measuring station is a digital measuring machine, the slave station equipment obtains data directly from the digital measuring machine through TCP/IP communication using Ethernet. If the measuring machine is an analog measuring machine, the slave station device obtains the data of the analog measuring machine via a digital transmitter (a device that converts analog values to digital signals) by TCP/IP communication using Ethernet. In particular, in the case of a water source measurement station, the slave station device obtains data from the load operator via TCP/IP communication using Ethernet.
Communication between slave station equipment and central station equipment
The measurement data, the status signal of the measuring device, etc. are transmitted and received between the slave station device and the central station device using TCP/IP. In addition, it also has a function to communicate with local workers by IP phone during maintenance and inspection of measuring machines and measuring stations.
Collective data collection at the Center
The central station device sends a data request signal every minute to the whole sub station device, and each sub station device sends measurement data to the requested signal. If data is not received for any reason, the central station device automatically recollects it. As a result, data from all stations and all items is collected at once, and the collected data is stored in the database. In this case, re-collection automatically performs scheduling so that it does not interfere with regular collection. In addition, in the case of air environment, air source, and water quality environment measurement stations, the central station equipment calculates the estimated and confirmed hourly value using the collected values.
Secondary operation server
Secondary operations use the one-hour value (primary data) stored by the central station equipment in the database to calculate emissions, load amount, etc., and store the operation results again in the database.
Understanding the operation status of the monitoring system
The operating table software always displays information on the operation of the constant monitoring system, such as the operation status of the measuring machine at each measuring station, whether there is a call request from each measuring station, and communication status between devices.
Records for centralized monitoring of air pollution status
The Central Bureau outputs atmospheric environment data to a recorder in real time to centrally monitor air pollutants such as photochemical smog, nitrogen oxides, and microparticulate matter.
3.Main functions of control and monitoring servers
The control and monitoring server compiles measurement data collected by the central station equipment and creates time signals, daily reports, etc. In addition, we will issue and release photochemical oxidant warning, etc., monitor microparticulate matter (PM2.5), disseminate high-concentration information to citizens, and monitor the source factories.
4.Main Functions of Analysis and Report Output Server
The analysis and form output server is based on the measurement data calculated and stored by the central station equipment and the secondary operation server, aggregates daily reports, monthly reports, annual reports, etc., output forms based on various report forms, and corrections to the stored measurement data. If this data correction changes the fixed 1-hour value or secondary operation result, it automatically recalculates.
The user interface has web-based data browsing, modification, and analysis pages, and can be accessed from PCs and other devices on the same network. Since all form outputs are processed sequentially and output, intermediate data is not kept on the system. You can always obtain output results using the latest data.
5.Main Functions of Database Servers
Database software running on database servers is required to comply with standard SQL. It manages measurement data stored in the database and provides an interface for reference, data correction, etc. from control and monitoring servers and analysis and report output servers. In addition, in order to be able to easily respond to the use of big data in the future and publicity to citizens, the data output function and the data interface must be highly scalable.
Inquiries to this page
Environmental Pollution Monitoring Center, Environmental Management Division, Environmental Protection Department, Green Environment Bureau
Telephone: 045-671-3507
Telephone: 045-671-3507
Fax: 045-681-2790
Email address: mk-kankyokanri@city.yokohama.lg.jp
Page ID: 706-980-218


