- Yokohama-shi Top Page
- Municipal Government Information
- About Yokohama-shi
- Statistics and Surveys
- Statistical information portal
- Major Statistical Survey Results
- Census
- 2000 Census
- 2000 Census Results Third Basic Aggregation Results
Here's the text.
2000 Census Results Third Basic Aggregation Results
Last Updated July 3, 2024
1 Occupational
2 Working hours
3 The period of residence of the head of household
4 Mother and child households and father and son households
Economic Composition of Five Households
6 Household status at the time of employment and commuting to school
7 Parent-Child living together
Explanation of Terms
Schedule of publication of major results in the future
Overview of the 2000 Census
Precautions for Use
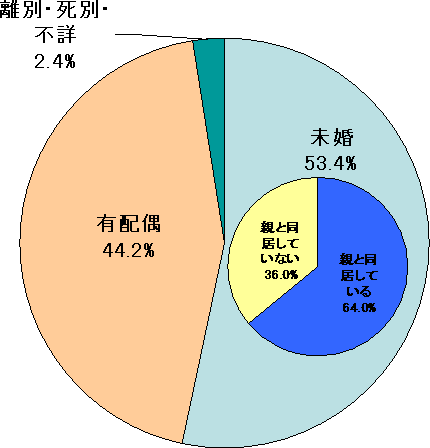
Percentage of living together non-living together parents of unmarried persons aged between 20 and 39
The increase in the unmarried rate has been cited as a cause of the declining birthrate in recent years. Of the 1,101,281 people aged 20 to 39 who are close to the average age of first marriage, 588,068 unmarried persons (53.4%) Of these, 376,130 people, or 64.0%, live with their parents, occupy more than occupies with their parents, accounting for the total population, accounting for more than accounted for the total population, accounting for more than 10%. (Refer to living together of Parents and Children)
2000 National Census “Third Basic Aggregation Results” (Overview of Yokohama City)
(1) Occupational Major Class Employers
Significant increase in the number of professional and technical professionals and service professionals.
Looking at the number of employees aged 15 and over in 2000 by major occupation, 401,784 employees (23.6% of employees), and 380,727 employees (22.4% of the total number of professional and technical workers) was 390,807,079,000, and 190,079. Compared to 1995, the number of “specialized and technical workers” increased by 19,005, and “service workers” increased by 13.2%, respectively. On the other hand, the number of “managed occupational workers” decreased by 31,975, or 35.1%, the largest in terms of actual numbers and rates, including “production processes and labor workers” (25,733, down 6.3%). It has become four occupations. As a result, the percentage by major occupation increased by 1.1 points for "specialized and technical occupation workers" and 1.0 points for "service occupation workers" compared to 1995, and "managed occupation workers" decreased by 1.9 points and "production processes and labor workers" decreased by 1.5 points. (Tables 1-1, 1-2)
Percentages of “production and labor workers” and “agriculture, forestry and fisheries workers” tend to shrink.
Looking at the trends in the proportion of major occupations, “specialized and technical occupations” increased from 6.4% in 1950 to 17.5% in 2000, and “office workers” increased from 16.7% to 23.6%, and “sales workers” increased from 11.0% to 17.3%. On the other hand, production processes and labor workers and agriculture, forestry and fisheries workers continued to shrink almost consistently from 37.9% and 12.0% in 1950, respectively, and in 2000, 22.4% and 0.6% respectively. The number of "managed workers" increased to 7.0% in 1980, but has since been in the 5% range, down to 3.5% in 2000, the same level as in 1950. The number of service workers remained in the 8-10% range until 1960, almost unchanged from the 6-7% range from 1940 to 8.6% in 2000. The number of transportation and telecommunications workers increased to 6.1% in 1965 during the period of high economic growth, but since then it has continued to shrink except in 1995, reaching 3.3% in 2000. (Table 1-2)
| Occupation (major category) | Number of employees | Number of changes | Change rate (%) | |||||
|---|---|---|---|---|---|---|---|---|
| 1990 | 7 years | 12 years | 1990 ~ 7 years | 7 to 12 years | 1990 ~ 7 years | 7 years ~ 12 years | ||
| Total number 1) | 1,618,075 | 1,700,629 | 1,699,750 | 82,554 | -879 | 5.1 | -0.1 | |
| A | Professional and technical professionals | 258,023 | 279,094 | 298,099 | 21,071 | 19,005 | 8.2 | 6.8 |
| B | Managed professional workers | 86,562 | 91,098 | 59,123 | 4,536 | -31,975 | 5.2 | -35.1 |
| C | Administrative employees | 385,480 | 399,662 | 401,784 | 14,182 | 2,122 | 3.7 | 0.5 |
| D | Sales personnel | 261,737 | 285,080 | 293,511 | 23,343 | 8,431 | 8.9 | 3.0 |
| E | Service professionals | 108,896 | 129,102 | 146,191 | 20,206 | 17,089 | 18.6 | 13.2 |
| F | Safety workers | 18,514 | 20,771 | 21,913 | 2,257 | 1,142 | 12.2 | 5.5 |
| G | Agriculture, forestry and fisheries workers | 10,962 | 10,859 | 9,682 | -103 | -1,177 | -0.9 | -10.8 |
| H | Transportation and telecommunications personnel | 55,549 | 58,360 | 56,353 | 2,811 | -2,007 | 5.1 | -3.4 |
| I | Production process and labor workers | 418,341 | 406,460 | 380,727 | -11,881 | -25,733 | -2.8 | -6.3 |
| (Reposted) | ||||||||
| I | Agriculture, forestry and fisheries-related occupations | 10,962 | 10,859 | 9,682 | -103 | -1,177 | -0.9 | -10.8 |
| II | Production and Transportation Occupations | 473,890 | 464,820 | 437,080 | -9,070 | -27,740 | -1.9 | -6.0 |
| III | Sales and service-related occupations | 389,147 | 434,953 | 461,615 | 45,806 | 26,662 | 11.8 | 6.1 |
| IV | Occupations related to office work, technology, and management | 730,065 | 769,854 | 759,006 | 39,789 | -10,848 | 5.5 | -1.4 |
1)Including "unclassified occupations".
The categories of the four occupations are as follows.
“I Agriculture, Forestry and Fisheries Occupation” = G “III Sales and Service Occupation” = D + E + F
“II Production and Transportation Occupation” = H+I “IV Office, Technology, and Management Occupation” = A+B+C
(2) Number of employees by 4 occupations
44.7% of occupations related to office work, technology, and management.
Looking at the number of employees by major occupation in four categories, "office work, technology, and management occupations" were the highest at 759,006 (44.7% of employees), followed by "sales and service occupations" at 461,615 (27.2%), and "production and transportation occupations" at 437,080 (5%). Compared to 1995, “sales and service-related occupations” increased by 1.6 points, while “production and transportation-related occupations” and “office, technical, and management-related occupations” decreased by 1.6 points or 0.6 points respectively. (Tables 1-1, 1-2, Fig. 1-1)
| Occupation (major category) | 1950 2) | 30 years | 35 years | 40 years | 45 years 3) | 50 years 3) | 1955 | 60 years | Heisei 2 years | 7 years | 12 years | |
|---|---|---|---|---|---|---|---|---|---|---|---|---|
| Total number 1) | 100.0 | 100.0 | 100.0 | 100.0 | 100.0 | 100.0 | 100.0 | 100.0 | 100.0 | 100.0 | 100.0 | |
| A | Professional and technical professionals | 6.4 | 6.8 | 6.4 | 6.0 | 9.2 | 9.4 | 10.5 | 14.3 | 15.9 | 16.4 | 17.5 |
| B | Managed professional workers | 3.5 | 3.6 | 3.6 | 4.3 | 6.5 | 6.4 | 7.0 | 5.1 | 5.3 | 5.4 | 3.5 |
| C | Office workers | 16.7 | 15.9 | 18.1 | 19.5 | 21.1 | 23.4 | 22.1 | 22.8 | 23.8 | 23.5 | 23.6 |
| D | Sales personnel | 11.0 | 13.6 | 11.9 | 13.0 | 11.9 | 13.7 | 15.2 | 15.7 | 16.2 | 16.8 | 17.3 |
| E | Service professionals | 9.4 | 10.3 | 8.7 | 7.0 | 6.8 | 7.0 | 6.7 | 6.7 | 6.7 | 7.6 | 8.6 |
| F | Safety workers | … | … | … | 1.3 | 1.3 | 1.3 | 1.3 | 1.2 | 1.1 | 1.2 | 1.3 |
| G | Agriculture, forestry and fisheries workers | 12.0 | 8.4 | 5.1 | 2.8 | 1.6 | 1.2 | 1.0 | 0.9 | 0.7 | 0.6 | 0.6 |
| H | Transportation and telecommunications personnel | 3.1 | 4.6 | 5.6 | 6.1 | 5.3 | 4.8 | 4.4 | 3.9 | 3.4 | 3.4 | 3.3 |
| I | Production process and labor workers | 37.9 | 36.8 | 40.5 | 40.1 | 36.2 | 32.2 | 31.3 | 28.8 | 25.9 | 23.9 | 22.4 |
| (Reposted) | ||||||||||||
| I | Agriculture, forestry and fisheries-related occupations | 12.0 | 8.4 | 5.1 | 2.8 | 1.6 | 1.2 | 1.0 | 0.9 | 0.7 | 0.6 | 0.6 |
| II | Production and Transportation Occupations | 40.9 | 41.4 | 46.1 | 46.1 | 41.5 | 37.1 | 35.7 | 32.7 | 29.3 | 27.3 | 25.7 |
| III | Sales and service-related occupations | 20.4 | 23.9 | 20.6 | 21.3 | 20.0 | 22.0 | 23.2 | 23.6 | 24.0 | 25.6 | 27.2 |
| IV | Occupations related to office work, technology, and management | 26.6 | 26.3 | 28.2 | 29.8 | 36.8 | 39.2 | 39.6 | 42.2 | 45.1 | 45.3 | 44.7 |
1)Including "unclassified occupations".
2)Number of employees transferred to 14 years old
3)Based on the results of 20% extraction.
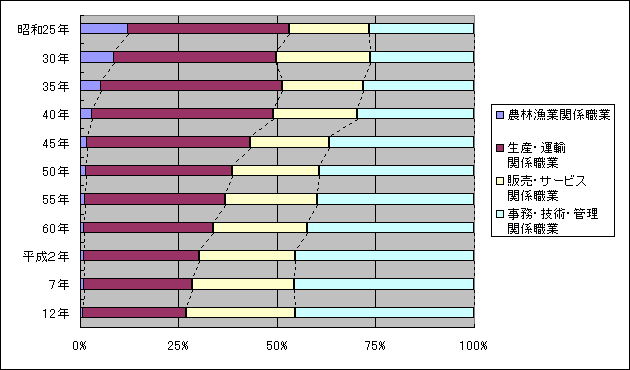
Figure 1-1 Age composition of population aged 15 and over and working population (2000)
(3) Occupational composition by gender
The ratio of "production processes and labor workers" for men and "office workers" for women is the highest.
Looking at the percentage of major occupations by gender, "production processes and labor workers" account for 27.5% of the total, followed by "sales workers" at 18.5%, "specialized and technical workers" at 18.4%, and "office workers" at 15.9%. On the other hand, "office workers" were the highest at 36.8%, followed by "specialized and technical workers" (16.1%), "sales workers" (15.1%), and "service workers" (14.1%), followed by "production process and labor workers" (13.7%), and 13.7% of other occupations. (Table 1-3)
Looking at the gender ratio of employees by major occupation, where women account for more than 50% of "service workers" and "office workers" is 63.1% for men and 36.9% for women. However, "transportation and telecommunications workers" (94.9% for men, 5.1% for women), and "9.3% for security workers" (9.3% for women) (9% for women). On the other hand, women account for more than 50% of service workers (39.5%, 60.5%) and office workers (42.5%, 57.5%). (Table 1-3, Figure 1-2)
| Occupation (major category) | Number of employees | Percentage by occupation (%) | Ratio by gender (%) | |||||||
|---|---|---|---|---|---|---|---|---|---|---|
| Total number | Men | Women | Total number | Men | Women | Total number | Men | Women | ||
| Total number 1) | 1,699,750 | 1,071,869 | 627,881 | 100 | 100 | 100 | 100 | 63 | 37 | |
| A | Professional and technical professionals | 298,099 | 196,964 | 101,135 | 17.5 | 18.4 | 16.1 | 100.0 | 66.1 | 33.9 |
| B | Managed professional workers | 59,123 | 53,656 | 5,467 | 3.5 | 5.0 | 0.9 | 100.0 | 90.8 | 9.2 |
| C | Office workers | 401,784 | 170,829 | 230,955 | 23.6 | 15.9 | 36.8 | 100.0 | 42.5 | 57.5 |
| D | Sales personnel | 293,511 | 198,727 | 94,784 | 17.3 | 18.5 | 15.1 | 100.0 | 67.7 | 32.3 |
| E | Service professionals | 146,191 | 57,753 | 88,438 | 8.6 | 5.4 | 14.1 | 100.0 | 39.5 | 60.5 |
| F | Safety workers | 21,913 | 20,562 | 1,351 | 1.3 | 1.9 | 0.2 | 100.0 | 93.8 | 6.2 |
| G | Agriculture, forestry and fisheries workers | 9,682 | 6,379 | 3,303 | 0.6 | 0.6 | 0.5 | 100.0 | 65.9 | 34.1 |
| H | Transportation and telecommunications personnel | 56,353 | 53,507 | 2,846 | 3.3 | 5.0 | 0.5 | 100.0 | 94.9 | 5.1 |
| I | Production process and labor workers | 380,727 | 294,806 | 85,921 | 22.4 | 27.5 | 13.7 | 100.0 | 77.4 | 22.6 |
| (Reposted) | ||||||||||
| I | Agriculture, forestry and fisheries-related occupations | 9,682 | 6,379 | 3,303 | 0.6 | 0.6 | 0.5 | 100.0 | 65.9 | 34.1 |
| II | Production and Transportation Occupations | 437,080 | 348,313 | 88,767 | 25.7 | 32.5 | 14.1 | 100.0 | 79.7 | 20.3 |
| III | Sales and service-related occupations | 461,615 | 277,042 | 184,573 | 27.2 | 25.8 | 29.4 | 100.0 | 60.0 | 40.0 |
| IV | Occupations related to office work, technology, and management | 759,006 | 421,449 | 337,557 | 44.7 | 39.3 | 53.8 | 100.0 | 55.5 | 44.5 |
1)Including "unclassified occupations".
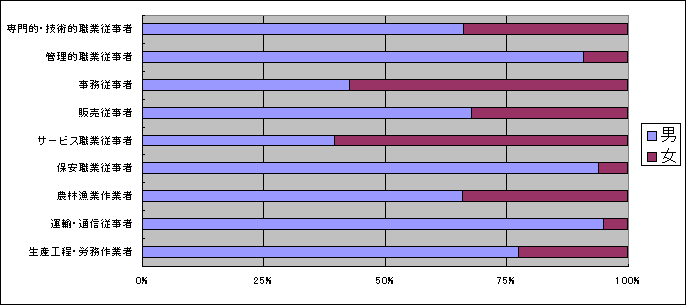
Figure 1-2 Percentage of employed persons by occupation (major category) by gender (2000)
(4) Occupational composition by age
The labor force ratio of women continues to rise
Looking at the age structure of workers by occupation, the highest percentage of workers under the age of 35 was "specialized and technical workers" (41.4%), followed by "service workers" (39.4%), "office workers" (38.8%), and "sales workers" (37.8%), and these occupations accounted for 6% of the total number of workers (3%). On the other hand, "agriculture, forestry and fisheries workers" (37.7%) have the highest percentage of older people aged 65 and over, followed by "managed workers" (17.7%). (Table 1-4, Figure 1-3)
| Occupation (major category) | Age ratio (%) | Percentage by occupation (%) | |||||||
|---|---|---|---|---|---|---|---|---|---|
| Total number | Under 35 years old | 35-64 years old | 65 years old or older | Total number | Under 35 years old | 35-64 years old | 65 years old or older | ||
| Total number 1) | 100.0 | 100.0 | 100.0 | 100.0 | 100.0 | 36.4 | 58.3 | 5.3 | |
| A | Professional and technical professionals | 17.5 | 20.0 | 16.5 | 12.3 | 100.0 | 41.4 | 54.8 | 3.7 |
| B | Managed professional workers | 3.5 | 0.3 | 4.7 | 11.6 | 100.0 | 3.6 | 78.7 | 17.7 |
| C | Office workers | 23.6 | 25.2 | 23.4 | 15.5 | 100.0 | 38.8 | 57.8 | 3.5 |
| D | Sales personnel | 17.3 | 17.9 | 16.9 | 17.1 | 100.0 | 37.8 | 57.0 | 5.3 |
| E | Service professionals | 8.6 | 9.3 | 8.0 | 10.2 | 100.0 | 39.4 | 54.4 | 6.3 |
| F | Safety workers | 1.3 | 1.1 | 1.4 | 1.6 | 100.0 | 29.8 | 63.6 | 6.7 |
| G | Agriculture, forestry and fisheries workers | 0.6 | 0.2 | 0.5 | 4.1 | 100.0 | 14.7 | 47.6 | 37.7 |
| H | Transportation and telecommunications personnel | 3.3 | 2.7 | 3.7 | 2.6 | 100.0 | 30.0 | 65.8 | 4.2 |
| I | Production process and labor workers | 22.4 | 20.7 | 23.4 | 23.0 | 100.0 | 33.7 | 60.9 | 5.4 |
| (Reposted) | |||||||||
| I | Agriculture, forestry and fisheries-related occupations | 0.6 | 0.2 | 0.5 | 4.1 | 100.0 | 14.7 | 47.6 | 37.7 |
| II | Production and Transportation Occupations | 25.7 | 23.5 | 27.1 | 25.6 | 100.0 | 33.2 | 61.5 | 5.3 |
| III | Sales and service-related occupations | 27.2 | 28.3 | 26.3 | 29.0 | 100.0 | 37.9 | 56.5 | 5.6 |
| IV | Occupations related to office work, technology, and management | 44.7 | 45.5 | 44.6 | 39.4 | 100.0 | 37.1 | 58.3 | 4.7 |
1)Including "unclassified occupations".
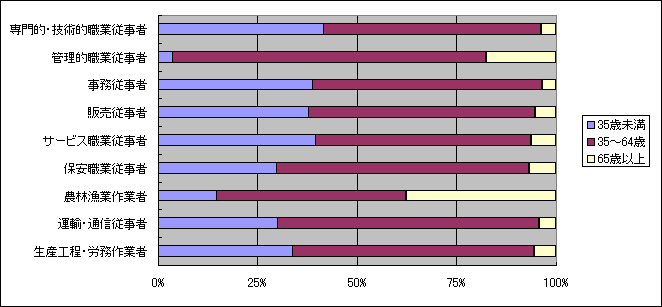
Figure 1-3 Percentage of employed persons by occupation (major category) by age (2000)
(5) Occupational composition by major industrial category
Approximately 40% of "service industry" workers are "specialized and technical workers".
Looking at the ratio of employment by major occupation type by major industry category, 72.8% of "specialized and technical occupation workers" were "service industry", 60.9% of "sales workers" were "wholesale and retail business", 51.3% of "security workers" were "public affairs", 82.1% of "agriculture, forestry and fisheries workers" were "transportation and communications" were " In addition, “managed occupations” and “office workers” have the highest percentage of “services” (25.1% and 32.1%, respectively), and “production processes and labor workers” have the highest percentage of “manufacturing” (33.6%). I am.
Next, looking at the ratio of workers by major industrial category by occupation, "agriculture" in the primary industry was 92.6% for "agriculture, forestry and fisheries workers", and "construction industry" and "manufacturing industry" in the secondary industry were the highest at 58.3% and 47.7%, respectively. In the tertiary industry, occupations concentrated according to their classification are different, "electricity, gas, heat supply and water supply", "financial and insurance" and "public affairs" (41.3%, 54.6%, respectively, 62.2%), and "transportation and telecommunications workers" (35.6%), industrial and non-retail businesses, restaurants, etc. 3%). (Table 1-5)
| Industry (major category) | Total number 1) | A Professional and technical professionals | B Managed professional workers | C Office workers | D Sales personnel | E Service professionals | F Safety workers | G Agriculture, forestry and fisheries workers | H Transportation and telecommunications personnel | I Production process and labor workers |
|---|---|---|---|---|---|---|---|---|---|---|
| Percentage by Industry (%) | ||||||||||
| Total number 2) | 100.0 | 100.0 | 100.0 | 100.0 | 100.0 | 100.0 | 100.0 | 100.0 | 100.0 | 100.0 |
| Agriculture | 0.5 | 0.0 | 0.1 | 0.1 | 0.1 | 0.0 | 0.0 | 82.1 | 0.0 | 0.0 |
| Forestry | 0.0 | 0.0 | 0.0 | 0.0 | - | - | - | 0.1 | - | - |
| Fishing | 0.0 | 0.0 | 0.0 | 0.0 | 0.0 | 0.0 | - | 4.1 | 0.0 | 0.0 |
| Mining | 0.0 | 0.0 | 0.0 | 0.0 | 0.0 | - | - | - | 0.0 | 0.0 |
| Construction | 9.4 | 6.9 | 12.5 | 6.2 | 3.8 | 0.4 | 0.3 | 5.8 | 2.2 | 24.4 |
| Manufacturing | 15.7 | 13.1 | 20.6 | 14.0 | 10.2 | 0.6 | 1.5 | 0.2 | 2.4 | 33.6 |
| Electricity, gas, heat supply, water supply | 0.5 | 0.4 | 0.3 | 0.9 | 0.2 | 0.0 | 0.1 | 0.0 | 0.1 | 0.9 |
| Transportation and telecommunications | 7.7 | 1.1 | 7.9 | 9.4 | 3.7 | 1.5 | 2.2 | 0.0 | 82.2 | 6.5 |
| Wholesale and retail businesses, restaurants | 24.0 | 4.0 | 21.7 | 19.8 | 60.9 | 47.3 | 1.0 | 2.0 | 2.9 | 14.0 |
| Financial and Insurance Business | 3.7 | 0.6 | 5.4 | 8.5 | 7.6 | 0.3 | 0.2 | 0.0 | 0.2 | 0.1 |
| Real estate business | 2.0 | 0.2 | 5.1 | 2.3 | 4.7 | 4.0 | 0.9 | 0.3 | 0.1 | 0.5 |
| Service industry | 32.0 | 72.8 | 25.1 | 32.1 | 8.8 | 45.8 | 42.3 | 5.2 | 9.0 | 19.9 |
| Public affairs (non-classified) | 2.5 | 0.9 | 1.1 | 6.6 | - | 0.1 | 51.3 | 0.1 | 0.9 | 0.2 |
| Percentage by occupation (%) | ||||||||||
| Total number 2) | 100.0 | 17.5 | 3.5 | 23.6 | 17.3 | 8.6 | 1.3 | 0.6 | 3.3 | 22.4 |
| Agriculture | 100.0 | 0.6 | 0.7 | 2.4 | 1.8 | 0.2 | 0.0 | 92.6 | 0.0 | 1.6 |
| Forestry | 100.0 | 11.1 | 5.6 | 38.9 | - | - | - | 44.4 | - | - |
| Fishing | 100.0 | 0.4 | 0.2 | 1.7 | 1.3 | 1.3 | - | 85.7 | 2.6 | 6.8 |
| Mining | 100.0 | 11.9 | 9.2 | 47.5 | 9.5 | - | - | - | 2.7 | 18.6 |
| Construction | 100.0 | 12.9 | 4.6 | 15.7 | 7.0 | 0.3 | 0.0 | 0.4 | 0.8 | 58.3 |
| Manufacturing | 100.0 | 14.5 | 4.5 | 21.0 | 11.2 | 0.3 | 0.1 | 0.0 | 0.5 | 47.7 |
| Electricity, gas, heat supply, water supply | 100.0 | 12.5 | 2.1 | 41.3 | 5.8 | 0.3 | 0.4 | 0.0 | 0.4 | 37.3 |
| Transportation and telecommunications | 100.0 | 2.5 | 3.6 | 28.9 | 8.3 | 1.7 | 0.4 | 0.0 | 35.6 | 19.0 |
| Wholesale and retail businesses, restaurants | 100.0 | 2.9 | 3.2 | 19.5 | 43.8 | 17.0 | 0.1 | 0.0 | 0.4 | 13.1 |
| Financial and Insurance Business | 100.0 | 3.1 | 5.1 | 54.6 | 35.8 | 0.7 | 0.1 | 0.0 | 0.2 | 0.4 |
| Real estate business | 100.0 | 2.0 | 8.7 | 26.1 | 39.9 | 16.8 | 0.6 | 0.1 | 0.2 | 5.5 |
| Service industry | 100.0 | 39.9 | 2.7 | 23.7 | 4.8 | 12.3 | 1.7 | 0.1 | 0.9 | 13.9 |
| Public affairs (non-classified) | 100.0 | 6.2 | 1.5 | 62.2 | - | 0.3 | 26.5 | 0.0 | 1.1 | 2.1 |
1)Including "unclassified occupations". 2)Including "unclassified occupations".
(6) Occupation of workers in administrative districts
In Aoba Ward, the percentage of occupations related to office work, technology and management exceeds 50%.
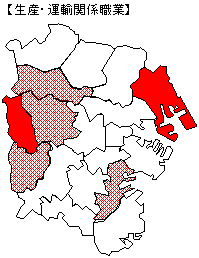
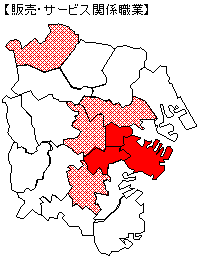
Looking at the percentage of employees in four categories by administrative division, Aoba Ward ranked highest at 53.8%, only more than 50%. Followed by Kohoku Ward (48.3%) and Kanazawa Ward (47.7%). Naka Ward ranked highest at 33.9%, followed by Nishi Ward at 31.0%, and Minami Ward at 30.8%, exceeding 30%. Tsurumi Ward (32.4%) and Seya Ward (32.3%) are more than 30%. “Agriculture, Forestry and Fisheries Workers” account for less than 1% except for Tsuzuki Ward (1.5%) and Izumi Ward (1.3%). (Table 1-6, Figure 1-4)
| Regional | Number of employees | Percentage by 4 occupations (%) | |||||||
|---|---|---|---|---|---|---|---|---|---|
| Total number 1) | I Agriculture, forestry and fisheries workers | II Production and Transportation Occupations | III Sales and service-related occupations | IV Occupations related to office work, technology, and management | I Agriculture, forestry and fisheries workers | II Production and Transportation Occupations | III Sales and service-related occupations | IV Occupations related to office work, technology, and management | |
| Yokohama-shi | 1,699,750 | 9,682 | 437,080 | 461,615 | 759,006 | 0.6 | 25.7 | 27.2 | 44.7 |
| Tsurumi Ward | 134,879 | 246 | 43,747 | 34,186 | 53,665 | 0.2 | 32.4 | 25.3 | 39.8 |
| Kanagawa Ward | 108,377 | 653 | 27,930 | 30,375 | 46,898 | 0.6 | 25.8 | 28.0 | 43.3 |
| Nishi Ward | 40,115 | 52 | 9,174 | 12,450 | 17,602 | 0.1 | 22.9 | 31.0 | 43.9 |
| Naka Ward | 59,783 | 94 | 13,692 | 20,248 | 24,557 | 0.2 | 22.9 | 33.9 | 41.1 |
| Minami Ward | 96,956 | 155 | 25,857 | 29,835 | 39,610 | 0.2 | 26.7 | 30.8 | 40.9 |
| Konan Ward | 107,900 | 344 | 26,889 | 29,563 | 49,620 | 0.3 | 24.9 | 27.4 | 46.0 |
| Hodogaya Ward | 99,338 | 395 | 26,213 | 28,010 | 42,516 | 0.4 | 26.4 | 28.2 | 42.8 |
| Asahi Ward | 122,476 | 676 | 33,362 | 31,749 | 53,871 | 0.6 | 27.2 | 25.9 | 44.0 |
| Isogo Ward | 82,541 | 169 | 22,721 | 22,235 | 35,835 | 0.2 | 27.5 | 26.9 | 43.4 |
| Kanazawa Ward | 98,135 | 573 | 23,619 | 25,944 | 46,857 | 0.6 | 24.1 | 26.4 | 47.7 |
| Kohoku Ward | 153,808 | 1,040 | 34,131 | 40,888 | 74,267 | 0.7 | 22.2 | 26.6 | 48.3 |
| Midori Ward | 78,292 | 709 | 21,913 | 20,065 | 33,885 | 0.9 | 28.0 | 25.6 | 43.3 |
| Aoba Ward | 130,734 | 795 | 21,377 | 35,833 | 70,291 | 0.6 | 16.4 | 27.4 | 53.8 |
| Tsuzuki Ward | 76,482 | 1,142 | 19,823 | 19,979 | 34,276 | 1.5 | 25.9 | 26.1 | 44.8 |
| Totsuka Ward | 123,794 | 893 | 32,491 | 31,916 | 56,191 | 0.7 | 26.2 | 25.8 | 45.4 |
| Sakae Ward | 57,680 | 369 | 14,388 | 15,246 | 26,780 | 0.6 | 24.9 | 26.4 | 46.4 |
| Izumi Ward | 69,889 | 889 | 20,809 | 17,468 | 29,495 | 1.3 | 29.8 | 25.0 | 42.2 |
| Seya Ward | 58,571 | 488 | 18,944 | 15,625 | 22,790 | 0.8 | 32.3 | 26.7 | 38.9 |
1)Including "unclassified occupations".
|
|
| |||
|---|---|---|---|---|---|
| 30% or more |
| 30% or more |
| 30% or more |
| 27% or more and less than 30% |
| 27% or more and less than 30% |
| 27% or more and less than 30% |
(7) Occupation of Foreign Employment
The number of professional and technical professionals increased by 22.5%.
Looking at the number of foreign residents aged 15 or older (20,411) who live permanently in Yokohama City by occupation, 6,407 "production processes and labor workers" (31.4% of foreign workers), followed by "service workers" 3,719 (18.2%) and "18.2% of professional and technical workers 4.9". Compared to 1995, the number of "specialized and technical occupations" increased significantly by 642 (22.5%), while the number of "managed occupations" decreased by 228 (24.1%). ). In addition, “service workers” and “production processes / labor workers” are 9.6 points and 9.0 points higher than the ratio of total employees, respectively, while “office workers” are 13.3 points lower. You. Table 1-7, Figure 1-5)
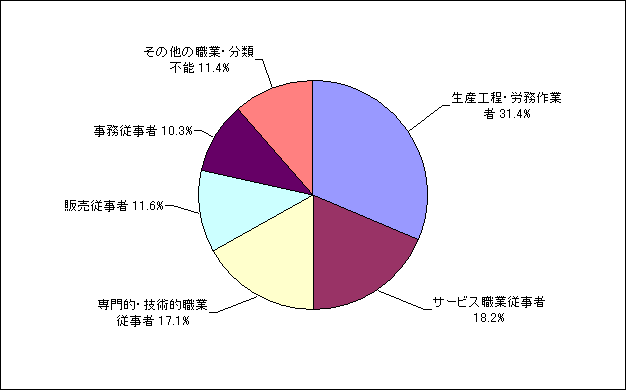
Figure 1-5 Ratio by occupation (major category) of foreign workers (2000)
| Occupation (major category) | Number of employees | Percentage (%) | Change from 1995 to 12 | (Reference) In 2000 Total number of employees Percentage (%) | ||||
|---|---|---|---|---|---|---|---|---|
| 1995 | 12 years | 1995 | 12 years | Number of changes | Change rate (%) | |||
| Total number 1) | 18,752 | 20,411 | 100.0 | 100.0 | 1659.0 | 8.8 | 100.0 | |
| A | Professional and technical professionals | 2,849 | 3,491 | 15.2 | 17.1 | 642.0 | 22.5 | 17.5 |
| B | Managed professional workers | 946 | 718 | 5.0 | 3.5 | -228.0 | -24.1 | 3.5 |
| C | Office workers | 1,930 | 2,105 | 10.3 | 10.3 | 175.0 | 9.1 | 23.6 |
| D | Sales personnel | 2,080 | 2,362 | 11.1 | 11.6 | 282.0 | 13.6 | 17.3 |
| E | Service professionals | 3,300 | 3,719 | 17.6 | 18.2 | 419.0 | 12.7 | 8.6 |
| F | Safety workers | 43 | 48 | 0.2 | 0.2 | 5.0 | 11.6 | 1.3 |
| G | Agriculture, forestry and fisheries workers | 28 | 27 | 0.1 | 0.1 | -1.0 | -3.6 | 0.6 |
| H | Transportation and telecommunications personnel | 412 | 362 | 2.2 | 1.8 | -50.0 | -12.1 | 3.3 |
| I | Production process and labor workers | 6,525 | 6,407 | 34.8 | 31.4 | -118.0 | -1.8 | 22.4 |
| (Reposted) | ||||||||
| I | Agriculture, forestry and fisheries-related occupations | 28 | 27 | 0.1 | 0.1 | -1.0 | -3.6 | 0.6 |
| II | Production and Transportation Occupations | 6,937 | 6,769 | 37.0 | 33.2 | -168.0 | -2.4 | 25.7 |
| III | Sales and service-related occupations | 5,423 | 6,129 | 28.9 | 30.0 | 706.0 | 13.0 | 27.2 |
| IV | Occupations related to office work, technology, and management | 5,725 | 6,314 | 30.5 | 30.9 | 589.0 | 10.3 | 44.7 |
1)Including "unclassified occupations".
"Transportation and telecommunications workers" are the longest in 48.0 hours.
The average weekly working hours for employees aged 15 and over are 42.1 hours, and by major occupation category, "transportation and telecommunications workers" are the longest at 48.0 hours, followed by "security workers" at 46.1 hours, "sales workers" at 45.0 hours, and "managed workers" at 44.7 hours. Looking at this by gender, "sale workers" (49.4 hours) for men and "security workers" for women (38.5 hours) for women are the longest.
Looking at the percentage of employees by major occupation by weekly working hours, the highest percentage of short-term employees less than 35 hours per week is "service workers" (42.7%). (Table 2-1, 2-2)
| Occupation (major category) | Total number | Men | Women | |
|---|---|---|---|---|
| Total number 1) | 42.1 | 47.0 | 33.8 | |
| A | Professional and technical professionals | 44.2 | 48.0 | 36.8 |
| B | Managed professional workers | 44.7 | 45.6 | 35.8 |
| C | Office workers | 39.0 | 45.3 | 34.3 |
| D | Sales personnel | 45.0 | 49.4 | 35.5 |
| E | Service professionals | 37.1 | 46.1 | 31.2 |
| F | Safety workers | 46.1 | 46.5 | 38.5 |
| G | Agriculture, forestry and fisheries workers | 39.4 | 42.7 | 33.2 |
| H | Transportation and telecommunications personnel | 48.0 | 48.6 | 36.1 |
| I | Production process and labor workers | 42.6 | 46.2 | 30.1 |
| Occupation (major category) | Total number 2) | 1-14 hours | 15-34 hours | 35-48 hours | 49-59 hours | 60 hours or more | |
|---|---|---|---|---|---|---|---|
| Number of employees | |||||||
| Total number 1) | 1,699,750 | 101,481 | 274,335 | 781,977 | 289,514 | 227,174 | |
| A | Professional and technical professionals | 298,099 | 17,156 | 30,328 | 136,480 | 64,583 | 44,710 |
| B | Managed professional workers | 59,123 | 2,044 | 4,975 | 31,606 | 11,020 | 8,636 |
| C | Office workers | 401,784 | 25,327 | 73,341 | 215,317 | 54,274 | 28,893 |
| D | Sales personnel | 293,511 | 14,180 | 40,389 | 119,646 | 58,977 | 57,397 |
| E | Service professionals | 146,191 | 18,986 | 43,422 | 44,170 | 16,011 | 21,550 |
| F | Safety workers | 21,913 | 554 | 2,705 | 10,977 | 3,657 | 3,697 |
| G | Agriculture, forestry and fisheries workers | 9,682 | 732 | 2,442 | 3,520 | 1,776 | 993 |
| H | Transportation and telecommunications personnel | 56,353 | 1,034 | 5,968 | 25,005 | 10,948 | 12,462 |
| I | Production process and labor workers | 380,727 | 17,465 | 63,363 | 183,420 | 64,669 | 46,292 |
| Percentage (%) | |||||||
| Total number 1) | 100.0 | 6.0 | 16.1 | 46.0 | 17.0 | 13.4 | |
| A | Professional and technical professionals | 100.0 | 5.8 | 10.2 | 45.8 | 21.7 | 15.0 |
| B | Managed professional workers | 100.0 | 3.5 | 8.4 | 53.5 | 18.6 | 14.6 |
| C | Office workers | 100.0 | 6.3 | 18.3 | 53.6 | 13.5 | 7.2 |
| D | Sales personnel | 100.0 | 4.8 | 13.8 | 40.8 | 20.1 | 19.6 |
| E | Service professionals | 100.0 | 13.0 | 29.7 | 30.2 | 11.0 | 14.7 |
| F | Safety workers | 100.0 | 2.5 | 12.3 | 50.1 | 16.7 | 16.9 |
| G | Agriculture, forestry and fisheries workers | 100.0 | 7.6 | 25.2 | 36.4 | 18.3 | 10.3 |
| H | Transportation and telecommunications personnel | 100.0 | 1.8 | 10.6 | 44.4 | 19.4 | 22.1 |
| I | Production process and labor workers | 100.0 | 4.6 | 16.6 | 48.2 | 17.0 | 12.2 |
1)Including "unclassified occupations".
2)Including employment period "unknown".
3 The period of residence of the head of household
Approximately 40% of the heads of households living in their homes have lived for more than 20 years.
Looking at the ratio of general households (1,300,696 households) living in houses in 2000 by the residence period of the head of household, "1 year to less than 5 years" was the highest at 26.7%, followed by "20 years or more" was 26.1%, "10 years or more and less than 20 years" was 17.0%, "10% and "10% and "10% and 10% and "10%". 2.3% of households whose head of household continues to live from birth. Looking at this by housing ownership, "more than 20 years" accounted for nearly 40% of owned homes, with 39.4% or nearly 40% of owned homes, and the living period is longer. On the other hand, the proportion of rented houses varies depending on the form, and about 60% of privately run rented houses and salary housing is `` less than 5 years '', while public rented houses account for `` more than 10 years '' The percentage is more than 50%, and more than 40% of rented houses of public corporations and public corporations, the living period is relatively long. (Table 3-1, Figure 3-1)
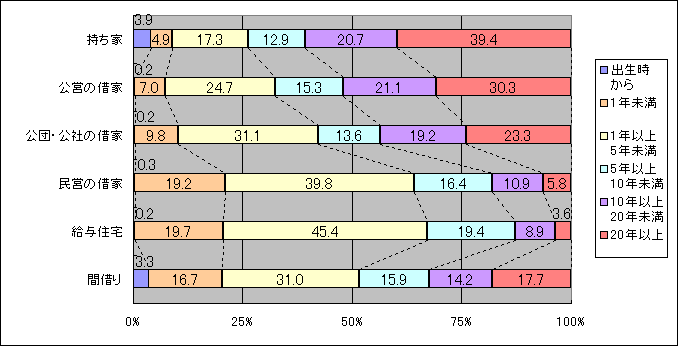
Figure 3-1 Percentage of the head of the household by residence period (2000)
| Type of residence Relationship of Housing Ownership | Total number 1) | From birth | Less than one year | 1 year or more Less than 5 years | 5 years or more Less than 10 years | More than 10 years Less than 20 years | More than 20 years |
|---|---|---|---|---|---|---|---|
| Real number | |||||||
| Total number | 1,353,526 | 30,139 | 150,738 | 370,487 | 197,008 | 222,952 | 339,894 |
| General households living in housing | 1,300,696 | 30,041 | 136,232 | 346,690 | 187,879 | 220,617 | 338,883 |
| A house | 724,844 | 27,993 | 35,406 | 125,745 | 93,371 | 150,268 | 285,754 |
| Public rental housing | 41,378 | 99 | 2,914 | 10,211 | 6,348 | 8,742 | 12,558 |
| Leased houses of public corporations and public corporations | 49,367 | 85 | 4,843 | 15,370 | 6,738 | 9,475 | 11,517 |
| Private leased houses | 397,674 | 1,072 | 76,426 | 158,427 | 65,144 | 43,319 | 23,179 |
| Salary housing | 68,118 | 154 | 13,417 | 30,954 | 13,215 | 6,066 | 2,451 |
| Loans | 19,315 | 638 | 3,226 | 5,983 | 3,063 | 2,747 | 3,424 |
| General households living outside of housing | 52,830 | 98 | 14,506 | 23,797 | 9,129 | 2,335 | 1,011 |
| Percentage (%) | |||||||
| Total number | 100.0 | 2.2 | 11.1 | 27.4 | 14.6 | 16.5 | 25.1 |
| General households living in housing | 100 | 2.3 | 10.5 | 26.7 | 14.4 | 17.0 | 26.1 |
| A house | 100 | 3.9 | 4.9 | 17.3 | 12.9 | 20.7 | 39.4 |
| Public rental housing | 100 | 0.2 | 7.0 | 24.7 | 15.3 | 21.1 | 30.3 |
| Leased houses of public corporations and public corporations | 100 | 0.2 | 9.8 | 31.1 | 13.6 | 19.2 | 23.3 |
| Private leased houses | 100 | 0.3 | 19.2 | 39.8 | 16.4 | 10.9 | 5.8 |
| Salary housing | 100 | 0.2 | 19.7 | 45.4 | 19.4 | 8.9 | 3.6 |
| Loans | 100 | 3.3 | 16.7 | 31.0 | 15.9 | 14.2 | 17.7 |
| General households living outside of housing | 100 | 0.2 | 27.5 | 45.0 | 17.3 | 4.4 | 1.9 |
1)Including "unknown" period of residence of the head of household.
4 Mother and child households and father and son households
More than 70% of mother-child households are the youngest children of junior high school students or younger.
In 2000, the number of mother and child households was 13,210 accounting for 0.98% of the total number of general households (1,353,526). In addition, the number of mother and child households is 34,637, and the number of households per household is 2.62, an increase of 0.12 from 2.50 in general households.
Compared to 1995, the number of mother and child households increased by 2,733 households (26.1%) and the number of households increased by 7,576 (28.0%).
death of spouse and divorce have 10,477 households (79.3%) and divorce have 80% of the total.
Looking at the number of mother and child households by the number of children, 6,711 households with "one child", 5,035 households with "two children", and 1,464 households with "three or more children", respectively, accounting for 50.8%, 38.1%, and 11.1%, respectively.
Looking at the number of mother-child households by age of children, 2,901 households (22.0% of mother-child households) have the youngest child under the age of six, and 6,980 households (52.8%) are elementary and junior high school students, and more than 70% have children before completing compulsory education. (Table 4-1)
| Mother's marital status Number of children Age of the youngest child | Real number | Percentage (%) | Change from 1995 to 12 | |||
|---|---|---|---|---|---|---|
| 1995 | 12 years | 1995 | 12 years | Number of changes | Change rate (%) | |
| Number of mother and child households 1) | 10,477 | 13,210 | 100.0 | 100.0 | 2,733 | 26.1 |
| (Mother's marital status) | ||||||
| death of spouse | 2,024 | 1,895 | 19.3 | 14.3 | -129 | -6.4 |
| divorce | 7,934 | 10,477 | 75.7 | 79.3 | 2,543 | 32.1 |
| (Number of children) | ||||||
| 1 person | 5,515 | 6,711 | 52.6 | 50.8 | 1,196 | 21.7 |
| 2 people | 3,960 | 5,035 | 37.8 | 38.1 | 1,075 | 27.1 |
| 3 or more | 1,002 | 1,464 | 9.6 | 11.1 | 462 | 46.1 |
| (Age of the youngest child) | ||||||
| Under 6 years old | 1,923 | 2,901 | 18.4 | 22.0 | 978 | 50.9 |
| 6-14 years old | 5,331 | 6,980 | 50.9 | 52.8 | 1,649 | 30.9 |
| 15-17 years old | 1,998 | 2,224 | 19.1 | 16.8 | 226 | 11.3 |
| 18-19 years old | 1,172 | 1,105 | 11.2 | 8.4 | -67 | -5.7 |
| Number of mother and child households | 27,061 | 34,637 | … | … | 7,576 | 28.0 |
| Number of employees per household | 3 | 3 | … | … | 0 | … |
| Number of children per household | 2 | 2 | … | … | 0 | … |
1)Including marital status "unmarried".
Half of the father-child households are the youngest children in elementary and junior high school students
In 2000, the number of father-child households was 2,270, accounting for 0.17% of the total number of general households (1,353,526 households). In addition, the number of father-child households is 5,848, and the number of households per household is 2.58, which is 0.08 more than 2.50 in general households.
Compared to 1995, the number of father-child households increased by 139 (6.5%) and the number of household members increased by 429 (7.9%). .
death of spouse has 683 households (30.1% of father-son households) and divorcedivorce has 1,550 households (68.3% of mother-child households).
Looking at the number of father-son households by the number of children, 1,186 households with "one child", 879 households with "two children", and 205 households with "three or more children". The ratio is 52.2%, 38.7%, and 9.0%, respectively.
Looking at the number of father-child households by age of children, the youngest children accounted for 1,136 households aged 6 to 14, but the ratio is as low as 10.8% (maternal and child households 22.0%) compared to mother-child households. 15-17 and 18-19% higher than those of high school students (39.5%). (Table 4-2)
| My father's marital status Number of children Age of the youngest child | Real number | Percentage (%) | Change from 1995 to 12 | |||
|---|---|---|---|---|---|---|
| 1995 | 12 years | 1995 | 12 years | Number of changes | Change rate (%) | |
| Number of father-child households 1) | 2,131 | 2,270 | 100.0 | 101.0 | 139 | 6.5 |
| (My father's marital status) | ||||||
| death of spouse | 702 | 683 | 32.9 | 30.1 | -19 | -2.7 |
| divorce | 1,401 | 1,550 | 65.7 | 68.3 | 149 | 10.6 |
| (Number of children) | ||||||
| 1 person | 1,152 | 1,186 | 54.1 | 52.2 | 34 | 3.0 |
| 2 people | 815 | 879 | 38.2 | 38.7 | 64 | 7.9 |
| 3 or more | 164 | 205 | 7.7 | 9.0 | 41 | 25.0 |
| (Age of the youngest child) | ||||||
| Under 6 years old | 154 | 246 | 7.2 | 10.8 | 92 | 59.7 |
| 6-14 years old | 1,015 | 1,136 | 47.6 | 50.0 | 121 | 11.9 |
| 15-17 years old | 593 | 555 | 27.8 | 24.4 | -38 | -6.4 |
| 18-19 years old | 369 | 333 | 17.3 | 14.7 | -36 | -9.8 |
| Number of father-child households | 5,419 | 5,848 | … | … | 429 | 7.9 |
| Number of employees per household | 3 | 3 | … | … | 0 | … |
| Number of children per household | 2 | 2 | … | … | 0 | … |
1)Including marital status "unmarried".
The employment rate of mothers in mother-child households is 80.5%
Looking at the ratio of mothers in mother-child households by labor force, 80.5% (employment rate), 6.8% were unemployed, and the combined labor force was 87.3% (labor rate), and the non-labor force population was 12.0%. The employment rate of mothers in mother-child households is much higher than the employment rate (43.1%) for all women aged 15 and over, and is extremely high for all age groups. (Table 4-3, Figure 4-1)
| Labor status | Age of mother of mother and child household | |||||
|---|---|---|---|---|---|---|
| Total number | 15-24 years old | 25~34 | 35~44 | 45~54 | 55 years old or older | |
| Real number | ||||||
| Total number 1) | 13,210 | 236 | 3,529 | 6,249 | 2,914 | 282 |
| Labor population | 11,530 | 191 | 3,082 | 5,561 | 2,507 | 189 |
| Employees | 10,632 | 158 | 2,772 | 5,187 | 2,341 | 174 |
| A completely unemployed person | 898 | 33 | 310 | 374 | 166 | 15 |
| Non-working population | 1,587 | 44 | 414 | 651 | 390 | 88 |
| Percentage (%) | ||||||
| Total number 1) | 100.0 | 100.0 | 100.0 | 100.0 | 100.0 | 100.0 |
| Labor population | 87.3 | 80.9 | 87.3 | 89.0 | 86.0 | 67.0 |
| Employees | 80.5 | 66.9 | 78.5 | 83.0 | 80.3 | 61.7 |
| A completely unemployed person | 6.8 | 14.0 | 8.8 | 6.0 | 5.7 | 5.3 |
| Non-working population | 12.0 | 18.6 | 11.7 | 10.4 | 13.4 | 31.2 |
1)Including labor force status "unknown".
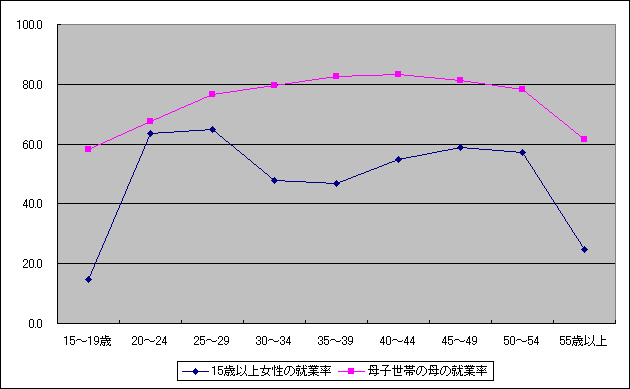
Figure 4-3 Labor Force Status by Age of Mothers of Maternal and Child Households (2000)
47.9% of mother-child households live in private rented houses
Looking at the ratio of mother and child households (12,981 households) living in houses by relationship, the number of homes owned is 24.0%, which is 31.7 points lower than the general households (55.7%). On the other hand, 47.9% of privately run rented houses and 16.7% of public rented houses, much higher than the total general households (30.6% and 3.2% respectively), and the proportion of households living in rented houses is higher. .
In addition, the total size of mother-child households living in houses is 54.3 m2 per household, and the total number of households per person is 54.3 m2 per household.
The area is 20.7m2, which is smaller than the entire general household (72.2m2 and 28.2m2 respectively).
Looking at the ratio of ownership of father-son households (2,258 households) living in houses by relationship, the number of homes owned is 44.6%, which is lower than the general households (55.7%), but is higher than mother-child households (24.0%). I am. On the other hand, 35.3% of privately run rented houses, 5.9% of publicly owned rented houses, 5.4% of public corporations and public corporations rented houses, and 4.6% of paid housing, accounting for more than half of the total rented houses, accounting for 51.3%, exceeding the total household (42.8%).
In addition, the size of the house of father-son households living in houses is 65.6 m2 per household and the total area per person is 25.4 m2, slightly smaller than the entire general household (72.2 m2, 28.2 m2, respectively). (Table 4-3)
| Relationship of Housing Ownership | Number of Households | Percentage (%) | Number of Households | 1 Household per household And personnel | Per household Total area (m2) | Per person Total area (m2) |
|---|---|---|---|---|---|---|
| Maternal and Child Households | ||||||
| Total number | 13,210 | … | 34,637 | 2.62 | … | … |
| Maternal and child households living in housing | 12,981 | 100.0 | 34,007 | 2.62 | 54.3 | 20.7 |
| A house | 3,115 | 24.0 | 8,207 | 2.63 | 79.8 | 30.3 |
| Public rental housing | 2,163 | 16.7 | 5,769 | 2.67 | 51.0 | 19.1 |
| Leased houses of public corporations and public corporations | 475 | 3.7 | 1,225 | 2.58 | 51.0 | 19.8 |
| Private leased houses | 6,214 | 47.9 | 16,126 | 2.60 | 43.2 | 16.7 |
| Salary housing | 184 | 1.4 | 488 | 2.65 | 55.5 | 20.9 |
| Loans | 830 | 6.4 | 2,192 | 2.64 | 52.1 | 19.7 |
| Mother and child households living outside of housing | 229 | … | 630 | 2.75 | … | … |
| Father and Child Households | ||||||
| Total number | 2,270 | … | 5,848 | 2.58 | … | … |
| Father and son households living in homes | 2,258 | 100.0 | 5,819 | 2.58 | 65.6 | 25.4 |
| A house | 1,006 | 44.6 | 2,659 | 2.64 | 85.4 | 32.3 |
| Public rental housing | 133 | 5.9 | 355 | 2.67 | 51.8 | 19.4 |
| Leased houses of public corporations and public corporations | 123 | 5.4 | 302 | 2.46 | 52.5 | 21.4 |
| Private leased houses | 798 | 35.3 | 1,986 | 2.49 | 47.6 | 19.1 |
| Salary housing | 104 | 4.6 | 274 | 2.63 | 57.1 | 21.7 |
| Loans | 94 | 4.2 | 243 | 2.59 | 52.6 | 20.4 |
| Father and son households living outside of housing | 12 | … | 29 | 2.42 | … | … |
1)Including labor force status "unknown".
Economic Composition of Five Households
“Non-employed households” increased significantly by 54.6%.
5,353,526 households (1,353,526 households) with 1,067,010 households with non-agriculture, forestry and fisheries (so-called salaried workers) in which all households are engaged in non-agriculture, forestry and fisheries (78.8%), followed by 260,460,000 non-employed households (non-employed households with no-employed households with no-employed households with no-employed households with no-employed, forestry and fishery, forestry and fishery, and fishery, and fishery, with 8%).
In recent years, the number of elderly-only households, such as elderly single-person households and elderly couple households, has increased, and as a result, the number of non-employed households increased significantly to 93,264 households, a rate of 54.6% compared to 1995. I am. (Table 5-1)
| Economic Composition of Households | Number of General Households | Percentage (%) | Change from 1995 to 12 | |||
|---|---|---|---|---|---|---|
| 1995 | 12 years | 1995 | 12 years | Number of changes | Change rate (%) | |
| Total number 1) | 1,251,392 | 1,353,526 | 100.0 | 100.0 | 102,134 | 8.2 |
| Agriculture, Forestry and Fishery Households | 2,618 | 2,580 | 0.2 | 0.2 | -38 | -1.5 |
| Mixed households of agriculture, forestry and fisheries and non-agriculture, forestry and fisheries | 3,531 | 2,838 | 0.3 | 0.2 | -693 | -19.6 |
| Non-agriculture, forestry and fishery workers | 1,062,576 | 1,067,010 | 84.9 | 78.8 | 4,434 | 0.4 |
| Non-employed households | 170,802 | 264,066 | 13.6 | 19.5 | 93,264 | 54.6 |
1)Including household economic composition "unclassified households"
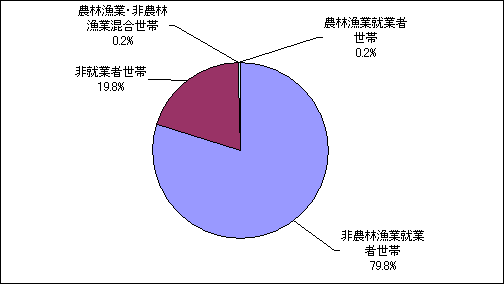
Figure 5-1 Ratio of General Households by Economic Composition (2000)
6 Household status at the time of employment and commuting to school
40.8% increase in the number of households where only elderly people are at home.
Regarding general households (1,300,696 households) living in houses in 2000, looking at the status of households at the time of employment and commuting, household members are considered to be out of office for commuting and commuting. Households are 457,847 households (35.2% of general households living in houses). On the other hand, 842,849 households (64.8%) are considered to have household members at home. Looking at the breakdown, 209,509 households (16.1%) are at home for "elderly people only" over the age of 65, and 25,304 households (1.9%) are under the age of 6. %) Etc. Compared to 1995, with the progress of aging, the number of households where only the elderly are at home has increased by 60,710 (40.8%), and the number of households with only infants has increased by 4,991 (24.6%). %). (Table 6-1, Figure 6-1)
| Composition of Household Members | Number of Households | Percentage (%) | Change from 1995 to 12 | |||
|---|---|---|---|---|---|---|
| 1995 | 12 years | 1995 | 12 years | Number of changes | Change rate (%) | |
| Total number 1) | 1,187,166 | 1,300,696 | 100.0 | 100.0 | 113,530 | 9.6 |
| Households with only commuters and students | 445,146 | 457,847 | 37.5 | 35.2 | 12,701 | 2.9 |
| Other Households | 742,020 | 842,849 | 62.5 | 64.8 | 100,829 | 13.6 |
| Of these, only elderly people | 148,799 | 209,509 | 12.5 | 16.1 | 60,710 | 40.8 |
| Of these, only elderly and infants | 1,128 | 1,139 | 0.1 | 0.1 | 11 | 1.0 |
| Only infants | 20,313 | 25,304 | 1.7 | 1.9 | 4,991 | 24.6 |
1) General households living in homes.
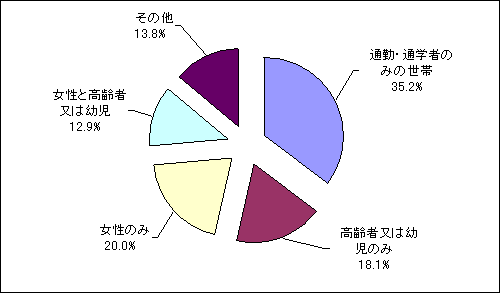
Figure 6-1 Percentage of households at the time of employment and commuting to school (2000)
7 Parent-Child living together
(1) living together with Parents
The living together rate with parents is 35.7%, and more than 90% of couples separate from parents.
Of the total population of 3,414,860 in 2000 (excluding "unknown age"), 1,218,456 in 2000, living together accounted for 35.7% of the total population.
The rate of living together with parents by gender is 36.7% for men and 34.7% for women, which is slightly higher for men.
The rate of living together with parents by marital status is as high as 77.3% because about half of unmarriages are minors, but only 7.9% are married and more than 90% are separated from parents. (Table 7-1, Figure 7-1)
| Marital status | Total number | Men | Women | ||||||
|---|---|---|---|---|---|---|---|---|---|
| Total number 2) | living together | Non-living together | Total number 2) | living together | Non-living together | Total number 2) | living together | Non-living together | |
| Real number | |||||||||
| Total number 1) | 3,414,860 | 1,218,456 | 2,196,120 | 1,727,309 | 633,198 | 1,094,003 | 1,687,551 | 585,258 | 1,102,117 |
| Unmarried | 1,370,117 | 1,059,302 | 310,623 | 764,802 | 555,660 | 209,055 | 605,315 | 503,642 | 101,568 |
| Marital status | 1,741,071 | 137,596 | 1,603,444 | 869,399 | 68,314 | 801,076 | 871,672 | 69,282 | 802,368 |
| death of spouse | 170,677 | 3,656 | 166,985 | 30,144 | 1,100 | 29,041 | 140,533 | 2,556 | 137,944 |
| divorce | 93,541 | 14,519 | 79,004 | 37,944 | 5,973 | 31,966 | 55,597 | 8,546 | 47,038 |
| Percentage (%) | |||||||||
| Total number 1) | 100.0 | 35.7 | 64.3 | 100.0 | 36.7 | 63.3 | 100.0 | 34.7 | 65.3 |
| Unmarried | 100.0 | 77.3 | 22.7 | 100.0 | 72.7 | 27.3 | 100.0 | 83.2 | 16.8 |
| Marital status | 100.0 | 7.9 | 92.1 | 100.0 | 7.9 | 92.1 | 100.0 | 7.9 | 92.0 |
| death of spouse | 100.0 | 2.1 | 97.8 | 100.0 | 3.6 | 96.3 | 100.0 | 1.8 | 98.2 |
| divorce | 100.0 | 15.5 | 84.5 | 100.0 | 15.7 | 84.2 | 100.0 | 15.4 | 84.6 |
1)Includes inability to judge living together Non-living together.
1)Including marital status "unknown". However, the age "unknown" is not included.
| Age | Total number | Men | Women | ||||||
|---|---|---|---|---|---|---|---|---|---|
| Total number 2) | living together | Non-living together | Total number 2) | living together | Non-living together | Total number 2) | living together | Non-living together | |
| Real number | |||||||||
| Total number 1) | 3,414,860 | 1,218,456 | 2,196,120 | 1,727,309 | 633,198 | 1,094,003 | 1,687,551 | 585,258 | 1,102,117 |
| Under 20 years old | 662,324 | 644,046 | 18,116 | 339,828 | 329,092 | 10,660 | 322,496 | 314,954 | 7,456 |
| 20 years old or older | 2,752,536 | 574,410 | 2,178,004 | 1,387,481 | 304,106 | 1,083,343 | 1,365,055 | 270,304 | 1,094,661 |
| 20-39 years old | 1,101,281 | 417,435 | 683,804 | 579,631 | 219,070 | 360,548 | 521,650 | 198,365 | 323,256 |
| Unmarried persons | 588,068 | 376,130 | 211,924 | 348,888 | 201,849 | 147,031 | 239,180 | 174,281 | 64,893 |
| 40-64 years old | 1,174,192 | 149,774 | 1,024,398 | 594,166 | 80,624 | 513,527 | 580,036 | 69,150 | 510,871 |
| 65 years old or older | 477,063 | 7,201 | 469,802 | 213,684 | 4,412 | 209,268 | 263,369 | 2,789 | 260,534 |
| Percentage (%) | |||||||||
| Total number 1) | 100.0 | 35.7 | 64.3 | 100.0 | 36.7 | 63.3 | 100.0 | 34.7 | 65.3 |
| Under 20 years old | 100.0 | 97.2 | 2.7 | 100.0 | 96.8 | 3.1 | 100.0 | 97.7 | 2.3 |
| 20 years old or older | 100.0 | 20.9 | 79.1 | 100.0 | 21.9 | 78.1 | 100.0 | 19.8 | 80.2 |
| 20-39 years old | 100.0 | 37.9 | 62.1 | 100.0 | 37.8 | 62.2 | 100.0 | 38.0 | 62.0 |
| Unmarried persons | 100.0 | 64.0 | 36.0 | 100.0 | 57.9 | 42.1 | 100.0 | 72.9 | 27.1 |
| 40-64 years old | 100.0 | 12.8 | 87.2 | 100.0 | 13.6 | 86.4 | 100.0 | 11.9 | 88.1 |
| 65 years old or older | 100.0 | 1.5 | 98.5 | 100.0 | 2.1 | 97.9 | 100.0 | 1.1 | 98.9 |
1)Includes inability to judge living together Non-living together.
1)Age "unknown" is not included.
More than 60% of unmarried persons aged between 20 and 39 live with their parents.
The rate of living together with parents by age is extremely high at 97.2% for minors under the age of 20, but 20.9% for those over the age of 20 and 79.1% for non-living together, or nearly 80% for parents. 1.5% of elderly people aged 65 and over, 7,201 live with their parents. In recent years, the increase in the rate of unmarriage among young people has contributed to the declining birthrate. The living together rate of 20 to 39 years old, which is close to the average age of first marriage, is 37.9%, but living together rate is higher for women (72.9%) compared to men (57.9%). In real numbers, 417,435 parents and unmarried living together in this age group account for 12.2% of the city's total population. (Table 7-2, Figure 7-1)
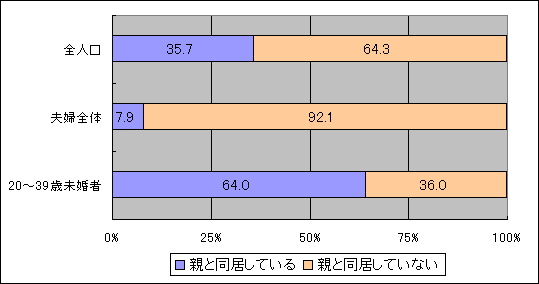
Figure 7-1 Percentage of living together Non-living together with Parents (2000)
(2) living together with a child
The living together rate with children is 52.8%.
Of the 1,206,638 people aged 50 and over, 637,193 live with children, 52.8% of the total population aged 50 and over, namely, the living together rate for children.
The living together rate for children by gender is 51.7% for men and 53.9% for women, which is slightly higher for women.
By marital status, the rate of living together with marital status is roughly the same as 57.5% for married couples and 57.9% for death of spouse, while divorce is less than 50% for 37.3%. (Table 7-3)
| Age | Total number | Men | Women | ||||||
|---|---|---|---|---|---|---|---|---|---|
| Total number 2) | living together | Non-living together | Total number 2) | living together | Non-living together | Total number 2) | living together | Non-living together | |
| Real number | |||||||||
| Population aged 50 and over 1) | 1,206,638 | 637,193 | 569,191 | 579,129 | 299,146 | 279,922 | 627,509 | 338,047 | 289,269 |
| Marital status | 896,915 | 515,687 | 381,184 | 475,937 | 279,527 | 196,392 | 420,978 | 236,160 | 184,792 |
| death of spouse | 165,608 | 95,914 | 69,659 | 28,805 | 14,407 | 14,397 | 136,803 | 81,507 | 55,262 |
| divorce | 54,668 | 20,396 | 34,195 | 23,060 | 4,246 | 18,806 | 31,608 | 16,150 | 15,389 |
| Percentage (%) | |||||||||
| Population aged 50 and over 1) | 100.0 | 52.8 | 47.2 | 100.0 | 51.7 | 48.3 | 100.0 | 53.9 | 46.1 |
| Marital status | 100.0 | 57.5 | 42.5 | 100.0 | 58.7 | 41.3 | 100.0 | 56.1 | 43.9 |
| death of spouse | 100.0 | 57.9 | 42.1 | 100.0 | 50.0 | 50.0 | 100.0 | 59.6 | 40.4 |
| divorce | 100.0 | 37.3 | 62.6 | 100.0 | 18.4 | 81.6 | 100.0 | 51.1 | 48.7 |
1)Includes inability to judge living together Non-living together.
1)Age "unknown" is not included.
The living together rate for elderly children is 40.7%.
Of the 477,053 elderly people aged 65 and over, 194,237 live with children, and the living together rate is 40.7%. Of these, the living together rate for younger elderly people aged 65 to 74 was 37.0%, while the living together rate for older people aged 75 and over was 47.2%, respectively.
The rate of living together for children aged 50 and over by age group decreases from 70.6% for those aged 50 to 54 to 35.4% for those aged 70 to 74. After that, it turned upward, exceeding 58.6% and 50% for those aged 85 and over. In addition, women have a higher rate of living together than men in each age group over 70 years old. (Table 7-4, Figure 7-2)
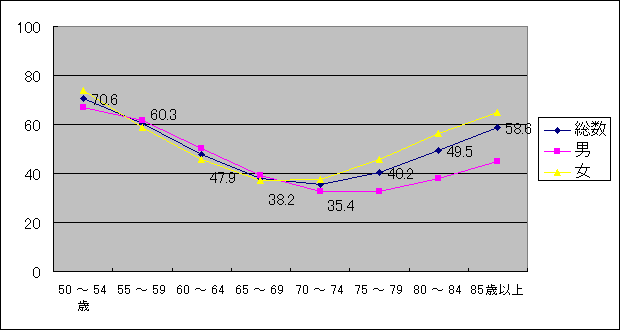
Figure 7-2 living together rate for children aged 50 and over by gender (2000)
| Age | Total number | Men | Women | ||||||
|---|---|---|---|---|---|---|---|---|---|
| Total number 2) | living together | Non-living together | Total number 2) | living together | Non-living together | Total number 2) | living together | Non-living together | |
| Real number | |||||||||
| Population aged 50 and over 1) | 1,206,638 | 637,193 | 569,191 | 579,129 | 299,146 | 279,922 | 627,509 | 338,047 | 289,269 |
| 65 years old or older | 477,053 | 194,237 | 282,754 | 213,684 | 78,025 | 135,645 | 263,369 | 116,212 | 147,109 |
| 65-74 years old | 302,215 | 111,707 | 190,463 | 146,610 | 53,462 | 93,136 | 155,605 | 58,245 | 97,327 |
| 75 years old or older | 174,838 | 82,530 | 92,291 | 67,074 | 24,563 | 42,509 | 107,764 | 57,967 | 49,782 |
| 85 years old or older | 40,739 | 23,884 | 16,854 | 12,896 | 5,814 | 7,082 | 27,843 | 18,070 | 9,772 |
| Percentage (%) | |||||||||
| Population aged 50 and over 1) | 100.0 | 52.8 | 47.2 | 100.0 | 51.7 | 48.3 | 100.0 | 53.9 | 46.1 |
| 65 years old or older | 100.0 | 40.7 | 59.3 | 100.0 | 36.5 | 63.5 | 100.0 | 44.1 | 55.9 |
| 65-74 years old | 100.0 | 37.0 | 63.0 | 100.0 | 36.5 | 63.5 | 100.0 | 37.4 | 62.5 |
| 75 years old or older | 100.0 | 47.2 | 52.8 | 100.0 | 36.6 | 63.4 | 100.0 | 53.8 | 46.2 |
| 85 years old or older | 100.0 | 58.6 | 41.4 | 100.0 | 45.1 | 54.9 | 100.0 | 64.9 | 35.1 |
1)Includes inability to judge living together Non-living together.
1)Age "unknown" is not included.
Occupational
Occupation refers to the type of work that the person actually engaged during the survey week (for "persons who took a break from work" during the survey week, the type of work that the person mainly engaged) ).
If you have more than one job you have engaged in, it depends mainly on the type of job you have been engaged in.
Major occupations may be consolidated into four categories, and the categories are as follows.
| I | Agriculture, forestry and fisheries-related occupations | G Agriculture, Forestry and Fisheries Workers |
|---|---|---|
| II | Production and Transportation Occupations | H Transportation/communication workers, I Production and Labor workers |
| III | Sales and service-related occupations | D Sales workers, E-service workers, F-security workers |
| IV | Occupations related to office work, technology, and management | A Professional/technical workers, B-managed workers, C clerical workers |
Working hours
Employment hours are classified into “time off”, “1-4 hours”, “5-9”, “10-14”, “15-19”, “20-24”, “25-29”, “30-34”, “35-39”, “4”, “4”, “5-39”, “4”, “5-39”, “4”.
Period of residence
Depending on the period of living in your current location, the period of residence is "from birth", "less than 1 year", "1 year to less than 5 years", "5 years to less than 10 years", "10 years or more and 20 years or more" It is divided into six categories: "less than 20 years".
Economic Composition of Households
Household economic composition is a classification provided to classify general households by the working conditions, employment status, and industry of the main employees of the household and their relatives.
The term "main household worker" here refers to the householder if the head of the household is a worker, and if the head of the household is not a worker, the employee who is closest to the head of the household in the questionnaire. .
In addition, economic activities of non-relatives living in the household are not considered if they are classified.
Regarding the employment status of the main employees of the household, "business owners" include "family employees" and "home employees" and "employees" include "officers". .
| Total classification | Total details | Table: | Scheduled to be announced | |
|---|---|---|---|---|
| Basic tabulation | 1st Basic tabulation | Results related to population, households and housing, and results related to elderly households, foreigners, etc. | Nationwide, prefectures Municipalities | October, 2001 Announced |
| 2nd Basic tabulation | Population labor force status, results on industry-specific composition and education of workers, and results on households with couples and children. | January, 2002 Announced | ||
| 3rd Basic tabulation | Results regarding the composition of employees by occupation and status of mother and child households, etc. | Announced this time | ||
| Employment location Total school location | 1 | Results related to the composition of population by employment / school location and the composition of employees by industry | Nationwide, prefectures Municipalities | April, 2002 Announced |
| 2 | Results of employment composition by employment location | May, 2003 | ||
| 3 | Detailed results regarding the composition of employees by industry and occupation by employment location | Nationwide, prefectures City with a population of more than 100,000 | July, 2004 | |
| Population migration total | 1 | Results on the migration status of population and results on the labor force status of migrating population, composition by industry and education | Nationwide, prefectures Municipalities | April, 2002 Announced |
| 2 | Results related to the composition of the moving population by occupation | Nationwide, prefectures City with a population of more than 200,000 | June, 2003 | |
1) Citys with a population of 100,000 or more and cities with a population of 200,000 or more in the “Tablesho Area” column include wards of 13 major cities.
2) The municipalities or municipalities in the “Table Chapter Area” column are the smallest tabulation areas to be tabulated in the relevant tabulation categories, and not all statistical tables are counted up to that area.
1 Purpose of the Survey
The census is the most basic statistical survey of the country conducted to clarify the actual situation of Japan's population, households, industrial structure, etc., and to obtain basic data on various administrative measures in the national and local governments. . The survey has been conducted almost every five years since 1920, and the 2000 census is the 17th time.
2. Date of Survey
The 2000 census was conducted as of midnight on October 1, 2000 (hereinafter referred to as "at the time of the survey").
3 Areas of Survey
The 2000 Census was conducted in areas of Japan except for the following islands stipulated in Article 1 of the Census Enforcement Regulations.
(1) Habomai Islands, Shikotan, Kunashir and Etorofu
(2) Takeshima Island located in Goka Village, Oki County, Shimane Prefecture
4 Targets of Survey
The 2000 Census was conducted on those who live permanently in Japan at the time of the survey. Here, "residential person" means a person who has lived or is supposed to live in the house for more than three months, and has lived or is supposed to live for more than three months. Those who do not have a house were considered "residents" at the place where they were at the time of the survey.
5. Matters to be investigated
In the 2000 census, a total of 22 items were surveyed, including 16 items related to household members, such as gender and date of birth, and 6 items related to households such as household types and number of household members.
6 Method of Survey
The 2000 census was conducted based on the flow of the General Affairs Agency (Statistics Bureau / Statistics Center)-Prefectures-Municipalities-Census Instructors-Census Investigators.
The survey was conducted by a method in which approximately 830,000 census members appointed by the Commissioner of the General Affairs Agency (approximately 23,000 in Motoichi) distributed and collected questionnaires for each household. In addition, the survey form was filled out by households in principle.
Precautions for Use
1 As the result figures are rounded to the nearest unit of the table, the total number and breakdown do not necessarily match the total.
2. “-” in Table 2 is no or no applicable number.…"is an unknown number.
3 A report containing the statistical table of the results of the Third Basic tabulation will be issued by the Statistics Bureau of the Ministry of Internal Affairs and Communications at a later date, `` 2000 National Census Report Volume 4 Employment Occupation (major category), household type 2 prefectures・ Municipalities 14 Kanagawa Prefecture ".
Inquiries to this page
General Affairs Department Statistical Information Division, Policy Management Bureau
Telephone: 045-671-4207
Telephone: 045-671-4207
Fax: 045-663-0130
Email address: ss-chosa@city.yokohama.jp
Page ID: 556-521-078


