


- Yokohama-shi Top Page
- Business
- Menu by field
- Environment, parks and sewers
- Living Environment conservation
- Chemical Substances
- PRTR
- Yokohama PRTR count results
Here's the text.
Yokohama PRTR count results
Last update date April 1, 2024
Total results of reported emissions and transfers in Yokohama City
Results for FY2022 Results
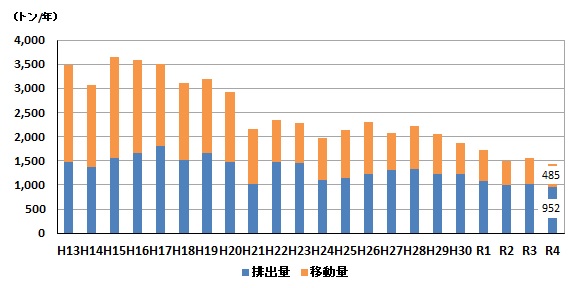
- The total amount of reported emissions and transfers was 1,437 tons, a decrease of 115 tons from the previous year.
- Reported emissions were 952 tons, a decrease of 70 tons from the previous year.
- The amount of reported transfer was 485 tons, a decrease of 45 tons from the previous year.
| Regional | Number of reports | Emissions (tons/year) | Transfer amount (ton/year) |
|---|---|---|---|
| Yokohama-shi | 365 | 952 | 485 |
| Kanagawa | 1,227 | 4,737 | 7,784 |
| Nationwide | 32,209 | 122,313 | 247,081 |
Report results from FY 2001 to FY 2022 results
Emissions and Transfers
Fiscal year | Number of reports | Emissions (tons/year) | Transfer amount (ton/year) | Emissions and Transfers | ||||||
|---|---|---|---|---|---|---|---|---|---|---|
Large | WED | SAT | Buried | Small | Down | Waste | Small | |||
| 2001 | 465 | 1,398 | 84 | 0 | 0 | 1,481 | 23 | 1,976 | 1,999 | 3,481 |
| 2002 | 464 | 1,295 | 82 | 0 | 0 | 1,378 | 16 | 1,670 | 1,686 | 3,063 |
| 2003 | 605 | 1,502 | 61 | 0 | 0 | 1,563 | 24 | 2,054 | 2,078 | 3,641 |
| 2004 | 561 | 1,614 | 57 | 0 | 0 | 1,671 | 15 | 1,891 | 1,907 | 3,578 |
| 2005 | 538 | 1,732 | 78 | 0 | 0 | 1,810 | 10 | 1,684 | 1,694 | 3,503 |
| 2006 | 546 | 1,453 | 63 | 0 | 0 | 1,516 | 11 | 1,591 | 1,602 | 3,118 |
| 2007 | 528 | 1,614 | 56 | 0 | 0 | 1,669 | 10 | 1,522 | 1,532 | 3,202 |
| 2008 | 510 | 1,404 | 61 | 0 | 0 | 1,465 | 10 | 1,451 | 1,461 | 2,926 |
| 2009 | 503 | 963 | 60 | 0 | 0 | 1,023 | 16 | 1,117 | 1,133 | 2,156 |
| 2010 | 453 | 1,396 | 69 | 0 | 0 | 1,465 | 31 | 843 | 874 | 2,339 |
| 2011 | 446 | 1,393 | 66 | 0 | 0 | 1,459 | 37 | 778 | 815 | 2,274 |
| 2012 | 439 | 1,051 | 61 | 0 | 0 | 1,112 | 28 | 840 | 868 | 1,980 |
| 2013 | 416 | 1,081 | 61 | 0 | 0 | 1,142 | 22 | 982 | 1,003 | 2,145 |
| 2014 | 422 | 1,170 | 63 | 0 | 0 | 1,233 | 33 | 1,033 | 1,067 | 2,299 |
| 2015 | 442 | 1,263 | 54 | 0 | 0 | 1,318 | 21 | 736 | 757 | 2,075 |
| 2016 | 399 | 1,274 | 60 | 0 | 0 | 1,334 | 20 | 861 | 881 | 2,215 |
| 2017 | 393 | 1,159 | 61 | 0 | 0 | 1,221 | 22 | 803 | 826 | 2,046 |
| 2018 | 379 | 1,125 | 99 | 0 | 0 | 1,225 | 24 | 617 | 641 | 1,866 |
| 2019 | 370 | 1,000 | 92 | 0 | 0 | 1,092 | 11 | 624 | 634 | 1,726 |
| 2020 | 353 | 910 | 87 | 0 | 0 | 997 | 17 | 485 | 502 | 1,499 |
| 2021 | 357 | 967 | 55 | 0 | 0 | 1,022 | 3 | 526 | 530 | 1,552 |
| 2022 | 365 | 898 | 54 | 0 | 0 | 952 | 5 | 480 | 485 | 1.437 |
Graph of changes over time of notification emissions and transfer volume
By substance
Download of the list from FY2013 to FY2012 (Excel: 185KB)
Download of the list from FY2011 to Reiwa 4 (Excel: 254KB)
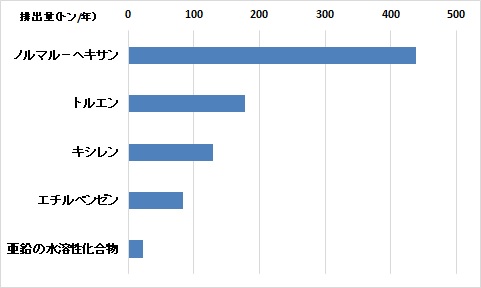
Reported emissions and transfer amount by substance in FY2022 results
Top 5 Substances Emissions
| Name of substance | To the atmosphere (ton/year) | To the water area (ton/year) | Total emissions (ton/year) |
|---|---|---|---|
| Normalohexane | 439 | 0 | 439 |
| Toluene | 178 | 0 | 178 |
| Xylene | 130 | 0 | 130 |
| Ethylbenzene | 83 | 0 | 83 |
| Water-soluble compounds of zinc | 0 | 22 | 22 |
| Total emissions of 462 substances | 898 | 54 | 952 |
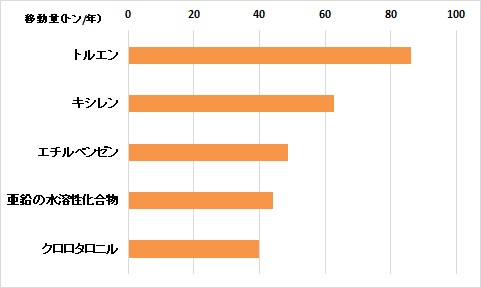
Top 5 Substances
| Name of substance | To the sewer (ton/year) | Waste (ton/year) | Total transfer amount (ton/year) |
|---|---|---|---|
| Toluene | 0 | 86 | 86 |
| Xylene | 0 | 63 | 63 |
| Ethylbenzene | 0 | 49 | 49 |
| Water-soluble compounds of zinc | 0 | 44 | 44 |
| Chlorothalonyl | 0 | 40 | 40 |
| Total transfer amount of 462 substances | 5 | 480 | 485 |
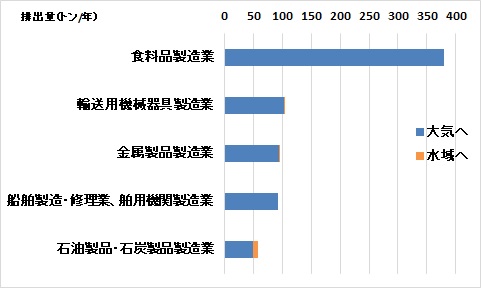
Reported emissions and transfers by industry in FY2022 results
Top 5 Emissions
| Industry | To the atmosphere (ton/year) | To the water area (ton/year) | Total emissions (ton/year) |
|---|---|---|---|
| Food manufacturing | 380 | 0 | 380 |
| Transportation machinery and equipment manufacturing | 102 | 1 | 103 |
| Manufacture of metal products | 95 | 0 | 95 |
| Ship manufacturing and repair, marine engine manufacturing | 93 | 0 | 93 |
| Petroleum and coal products manufacturing | 49 | 9 | 58 |
| Total emissions of 462 substances | 898 | 54 | 952 |
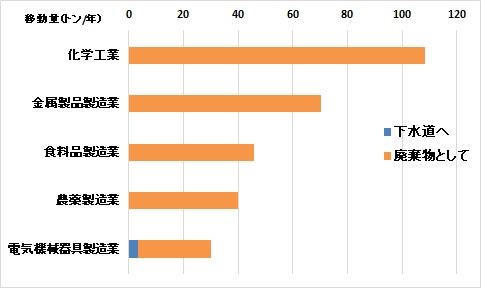
Top 5 Industries Transfers
| Industry | To the sewer (ton/year) | Waste (ton/year) | Total transfer amount (ton/year) |
|---|---|---|---|
| Chemical Industry | 0 | 108 | 109 |
| Manufacture of metal products | 0 | 70 | 70 |
| Food manufacturing | 0 | 46 | 46 |
| Agrochemical manufacturing | 0 | 40 | 40 |
| Electric machinery and equipment manufacturing | 4 | 26 | 30 |
| Total transfer amount of 462 substances | 5 | 480 | 485 |
※Emissions and transfers described on this page are rounded to the nearest unit. Therefore, for example, when each value is added, it may not match the description of the corresponding total value.
※The figures in each table may be revised because the PRTR system allows the revision of previous year notifications.
※Please see Kanagawa homepage (outside site) about discharge (estimation value) outside report of Yokohama-shi.
Inquiries to this page
Environmental Management Division, Environmental Protection Department, Green Environment Bureau
Telephone: 045-671-2487
Telephone: 045-671-2487
Fax: 045-681-2790
Email address: mk-kagaku@city.yokohama.lg.jp
Page ID: 870-116-347


