


For inquiries regarding water supply, please contact the Water Works Bureau Customer Service Center.
Water Works Bureau Customer Service Center
Telephone: 045-847-6262 Fax: 045-848-4281
※Please be careful not to make a mistake.


Search by keyword
Here's the text.
Last Updated October 23, 2024
"Environmental accounting" is a mechanism to quantify and publish as much as possible how much cost has been invested and how much effect has been obtained for environmental conservation initiatives such as global warming countermeasures. (Aggregation range: water supply business and industrial water supply business).
The investment in the construction of facilities and equipment for environmental measures was 1,528.51 million yen, and the cost of maintenance and management of facilities was 3,509 million yen. These are approximately 4 percent of Water Works Bureau's spending in fiscal 2022 (approximately 120 billion yen).
The main components of this investment were: 815.23 million yen for the redevelopment of water purification plants and 523.21 million yen for the prevention of pollution and conservation for the replacement of power-saving pump equipment.
The cost consists of 819.42 million yen for the treatment of wastewater sludge from water treatment plants, 814.92 million yen for the prevention of pollution, 814.92 million yen for the improvement of the environment for dam lakes, etc., conservation for the global environment, and 1,637.85 million yen for the recycling of construction waste.
| Classification | Main Initiatives | Investments (Thousands of yen) | Costs (Thousands of yen) | |
|---|---|---|---|---|
| (1) Costs in Business Areas | Costs incurred by Water Works Bureau's business activities from water sources to faucets | 1,528,506 | 3,272,184 | |
Inside Translation | ①Pollution prevention costs | Redevelopment of Nishiya Water Purification Plant, wastewater sludge treatment of water purification plant | 815,227 | 819,416 |
| ②Global environment conservation cost | Renewing to power-saving pump equipment, improving the environment of dam lakes, managing water source forests, etc. | 523,208 | 814,922 | |
| ③Resource recycling costs | Purchase of recycled water meters, recycling of construction waste materials, waste disposal, water leakage prevention measures, etc. | 190,071 | 1,637,846 | |
| (2) Cost of management activities | Outsourcing of weeding work, publicizing water supply business, etc. | 0 | 229,290 | |
| (3) Cost of social activities | PR of water source forests, subsidies for volunteers for Doshi water source forests, etc. | 0 | 7,530 | |
| Total | 1,528,506 | 3,509,004 | ||
As a result of our efforts to preserve the environment, such as the use of power-saving equipment and the management of water source forests, we achieved a reduction of 17,563 tons in terms of carbon dioxide (CO2) emissions.
This is equivalent to the amount of CO2 emitted by 6,834 households (explanatory notes) in one year. In addition, 151,652 tons of debris generated during construction were recycled, and 321,486 tons of recycled materials were used as construction materials to make effective use of resources.
Note: Annual CO2 emissions per household 2.57 tons (from the Ministry of the Environment's “Summary of Survey Results of Statistics on CO2 Emissions in the Home Sector in FY2022 (Preliminary figures)”)
| Greenhouse gas reduction effect | Unit: t-CO2 | |
|---|---|---|
| ①Introduction of equipment Reduction effect of environmental impact substances | Emission prevention through the use of power-saving equipment (Power-saving pumps, small hydroelectric power generation, solar power generation) | 2,826 |
| ②From business activities Accompanying conservation effect | Prevention of discharge due to prevention of water leakage | 161 |
| Amount absorbed by water source forests | 14,576 | |
| Total amount of reduction | 17,563 | |
| Environmental conservation effects through effective use of resources | Unit: t | ||
|---|---|---|---|
| ③Effective use of resources | Recycling of debris | Asphalt | 139,792 |
| Concrete | 11,860 | ||
| Use of recycled materials | Recycled asphalt | 130,019 | |
| Recycled crushed stone | 191,467 | ||
As a result of our efforts to preserve the environment, the total amount of profits obtained and cost reductions was 616.64 million yen.
Revenues amounted to 158.23 million yen for waste recycling, such as the sale of water meters, and 38.08 million yen for small hydro and solar power sales.
Cost savings amounted to 291.47 million yen for the use of recycled materials in construction and 121.28 million yen for the use of power-saving equipment.
| Contents of Economic Effects | Unit: 1,000 yen | |
|---|---|---|
| Net income | Recycling of waste | 158,225 |
| Small hydroelectric power generation and solar power generation | 38,075 | |
| Subtotal | 196,300 | |
| Cost reduction | Use of recycled materials in construction and reuse of generated soil | 291,467 |
| Utilization of power-saving equipment (power-saving pumps, small hydroelectric power generation, solar power generation) | 121,281 | |
| Prevention of water leakage | 7,593 | |
| Subtotal | 420,341 | |
| Total | 616,641 | |
In order to deliver safe and high-quality water, Water Works Bureau consumes a lot of energy, including electricity, and emits greenhouse gases such as CO2.
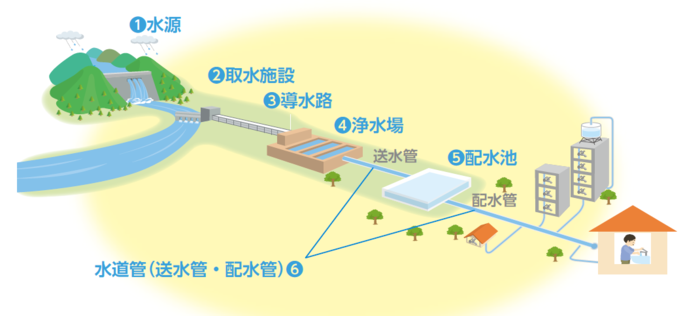
Tables 5 and 6 represent the energy and resources (= inputs) consumed before water is delivered using dams and rivers as water sources, and the substances emitted (= outputs).
| Energy and resources consumed (input) | |||
|---|---|---|---|
❶~ ❶ Water intake and water supply | ❹Purified water | ❺~ Water transmission and distribution | Total amount of input |
| <Energy> Power: 21,249 thousand kWh Fuel: 3,825ℓ Gas: 373m3 [Resources] Chemicals: 253t | <Energy> Power: 71,805 thousand kWh Fuel: 27,259ℓ Gas: 2,449m3 [Resources] Chemicals: 11,680t | <Energy> | <Energy> Power: 131,187 thousand kWh Fuel: 139,841ℓ Gas: 69,014m3 [Resources] Chemicals: 11,933t |
| Substances discharged (outputs) | |||
|---|---|---|---|
| ❶~ ❶ Water intake and water supply | ❹Purified water | ❺~ Water transmission and distribution | Total output |
<Greenhouse gas> | <Greenhouse gas> | <Greenhouse gas> | <Greenhouse gas> 59,867t-CO2 [Waste] Waste generated from water purification treatment 3,746t Water works generated soil 204,910t |
Please refer to this file for information on Water Works Bureau's environmental initiatives.
•Water Works Bureau and the Environment <Environmental Initiatives> (PDF: 943KB)
•Water Works Bureau and the Environment <Environmental Initiatives> (PDF: 7,148KB)
•Water Works Bureau and the Environment <Environmental Accounting> (PDF: 1,059KB)
•Water Works Bureau and the Environment <Environmental Initiatives> (PDF: 937KB)
•Water Works Bureau and the Environment <Environmental Accounting> (PDF: 903KB)
Water Works Bureau Customer Service Center
Telephone: 045-847-6262 Fax: 045-848-4281
※Please be careful not to make a mistake.
You may need a separate PDF reader to open a PDF file.
If you do not have it, you can download it free of charge from Adobe.
![]() To download Adobe Acrobat Reader DC
To download Adobe Acrobat Reader DC
Corporate Planning Division, Water Works Bureau Management Department
Telephone: 045-671-4887
Telephone: 045-671-4887
Fax: 045-212-1157
Email address: su-keieikikaku@city.yokohama.lg.jp
Page ID: 432-288-787


