


- Yokohama-shi Top Page
- Tsurumi Ward Top Page
- Ward Administration Information
- Statistics and Surveys
- 4 Living and Environment
Here's the text.
4 Living and Environment
Last Updated July 1, 2024
(1) Housing
| Tsurumi Ward | Yokohama-shi |
|---|---|---|
Single-family house | 44,745 | 637,230 |
A tenement house | 895 | 19,514 |
Apartment house | 96,236 | 1,064,905 |
Others | 184 | 1,656 |
Total | 142,060 | 1,723,305 |
Looking at how to build a house, there are 96,236 apartments with the largest number of apartments, and about two-thirds of households living in apartments. Next, single-family homes are 44,745 households (31.5%). In addition, the ratio of households living in apartment houses is 67.7%, which is 5.9% higher than 61.8% of Yokohama City as a whole.
Materials: 2020 National Census
Tsurumi Ward | Yokohama-shi | Nationwide | |
|---|---|---|---|
Vacancy rate (%) | 10.7 | 9.7 | 13.6 |
Total number of houses (doors) | 151,690 | 1,835,800 | 62,407,400 |
Number of vacant houses (units) | 16,280 | 178,300 | 8,488,600 |
The ratio of vacant houses in Tsurumi Ward is 16,280, accounting for 10.7%. Compared to 9.7% of Yokohama City as a whole, the percentage of vacant houses in Tsurumi Ward is 1.0 percentage points higher.
Materials: 2018 Housing and Land Statistics Survey
Open data
Number of households by way of building a house (CSV: 484bytes)
(2) Fire Department
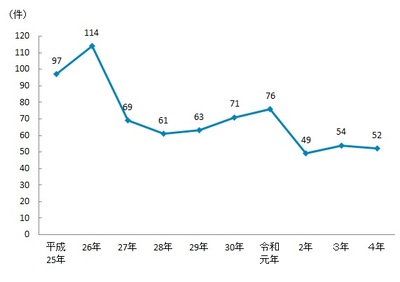 Changes in the number of fires
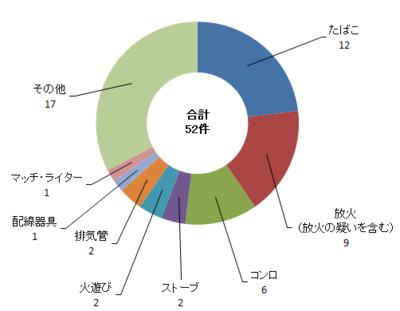 Number of Fire Causes
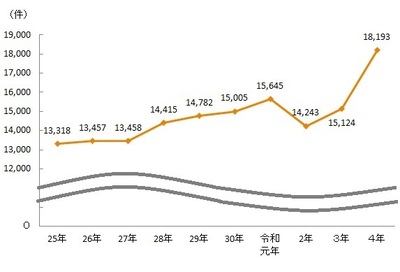 Changes in the number of ambulances dispatched
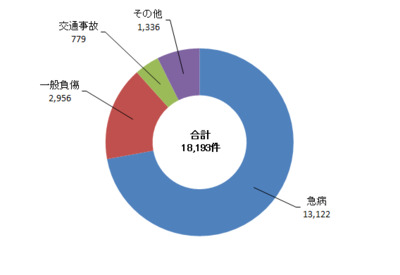 Reason for dispatch of ambulance
The number of fires in Tsurumi Ward during 2022 was 52, a decrease of two from the previous year. The most common cause of fire is "cigarettes" 12 cases, followed by "arson (including suspected arson)". The number of ambulances dispatched in Tsurumi Ward during 2022 was 18,193, an increase of 3,069 from the previous year. As for the reason for dispatch, sudden illness accounts for about 70% of the total.
Materials: Tsurumi fire department
Open data
(3) Transportation
●Average number of passengers per day by station in the ward
JR Yako Station | 16,348 (15,135) |
| JR Shitte Station | 13,069 (12,328) |
JR Tsurumi Station | 66,024 (61,833) |
Keikyu-Tsurumi Station | 13,904 (13,090) |
Tsurumi-Ichiba Station | 9,081 (8,462) |
Kagetsu Sojijiji Station | 3,095 (2,939) |
Namamugi Station | 13,056 (11,944) |
Materials: Yokohama City Statistical Report (Tsurumi Line has not been published)
●Number of traffic accidents and trends in the dead and injured
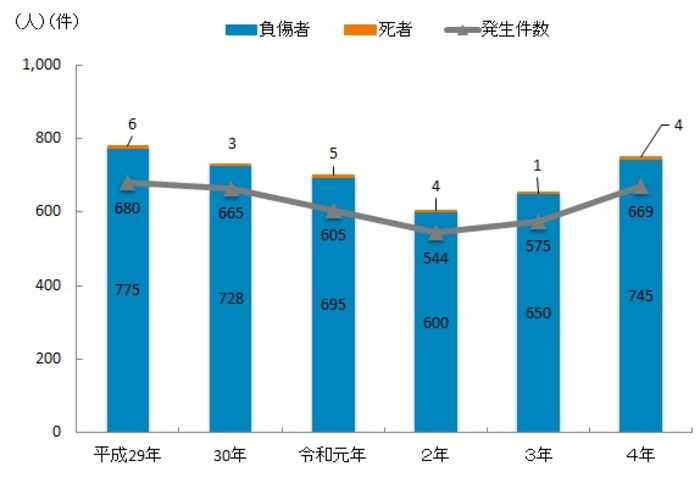
There were 669 traffic accidents during 2022, with 745 in injured and 4 dead. In addition, all items increased compared to the previous year.
Materials: Tsurumi police department
Open data
Average daily passengers by station in the ward (CSV: 366 bytes)
Number of traffic accidents and trends in fatalities and injured (CSV: 398 bytes)
(4) Crime
●The number of acknowledgement cases by type of crime (Criminal Code offense) (2022)
A violent criminal | A violent offense | Thieves | Intelligent criminal | Customs criminal | Other criminal offenses | Total number | ||
|---|---|---|---|---|---|---|---|---|
| Bicycle | Others | |||||||
Tsurumi Ward | 12 | 86 | 244 | 404 | 76 | 18 | 141 | 981 |
Yokohama-shi | 112 | 1,187 | 2,546 | 7,284 | 1,312 | 209 | 1,553 | 14,203 |
The number of crimes in Tsurumi Ward increased by 33 compared with last year, and the total number of crimes in Yokohama increased by 1,457.
Materials: Tsurumi police department
●Trends in the number of crimes (Criminal Penal Code offenses) acknowledgement
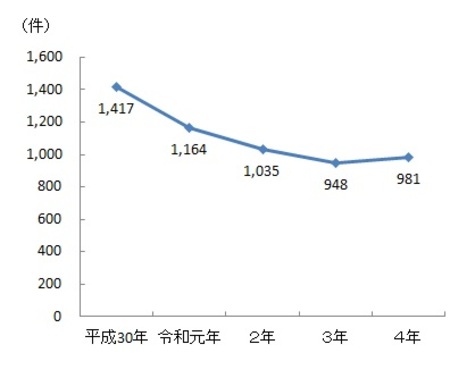
The number of acknowledgement crimes in Tsurumi Ward during 2022 was 981, which turned to an increase from a continuing decline since 2013.
Materials: Tsurumi police department
●Changes in the number of special frauds
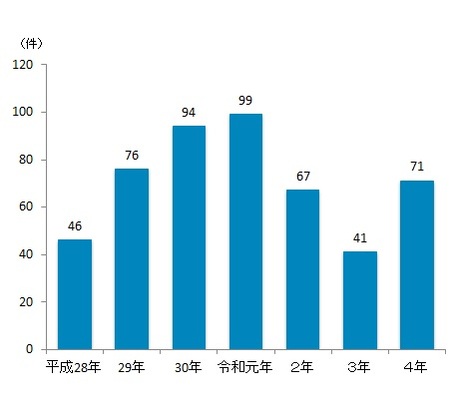
The number of special frauds, which had been increasing between 2015 and 2019, decreased from 2020 to 3 years, but increased in 2022 compared to the previous year.
Materials: Tsurumi police department
Open data
(5) Environment
●Green coverage ratio (2019 survey)
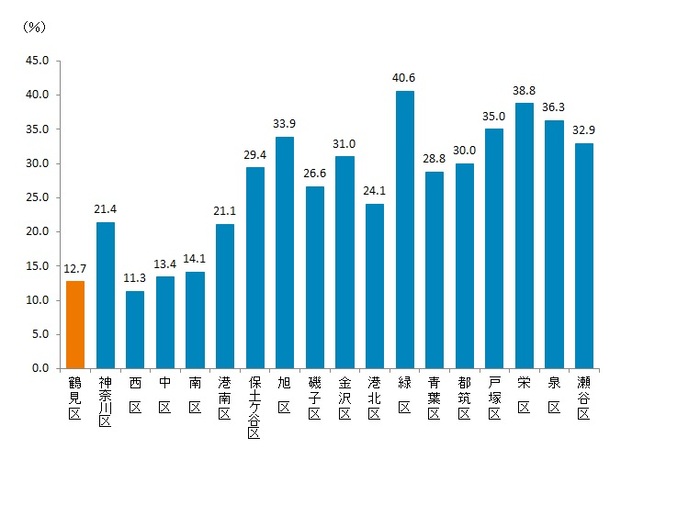
Materials: Yokohama City Statistical Report
●Number of distinct parks and park area (including prefectural parks, as of March 31, 2024)
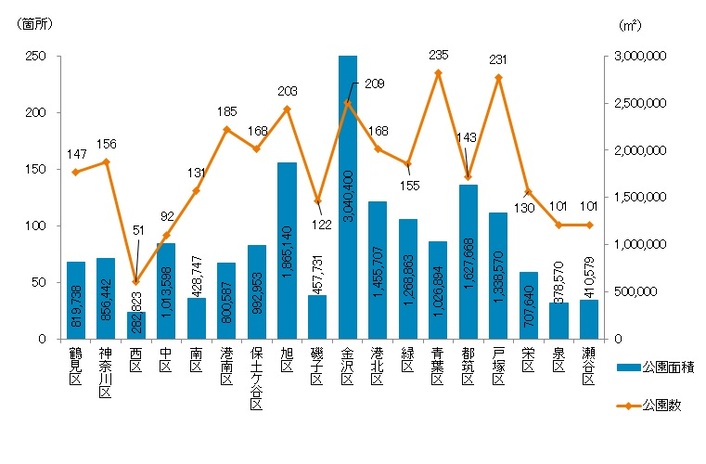
As of March 31, 2024, Tsurumi Ward has 147 parks, covering an area of 819,738 square meters. Of these, prefectural Mitsuike Park accounts for 296,838m2, accounting for about 40% of the park area in the city.
Materials: Environmental Planning Bureau
Open data
Green coverage, number of distinct parks, park area (including prefectural parks) (CSV: 1KB)
(6) City tax
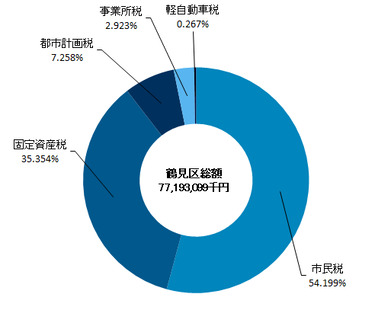
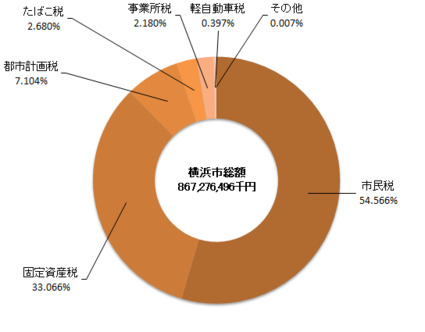
The city tax revenue for Yokohama City in fiscal 2022 was approximately 867.3 billion yen, an increase of approximately 28.4 billion yen compared to the previous year. By tax, "personal municipal tax" and "corporate municipal tax" increased due to an increase in salary income taxpayers, and "property tax (land house)" increased due to an increase in new houses. In fiscal 2022, Tsurumi Ward's city tax revenue was approximately 77.2 billion yen, accounting for approximately 8.90% of the total city.
●Composition ratio of city tax revenue (FY2022)
●Tsurumi Ward Net Income by Tax
![]() Municipal tax
Municipal tax
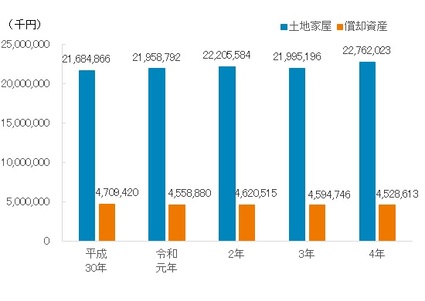 Property tax
Materials: Fiscal 2022 City Tax Settlement Amount
Open data
Tsurumi Ward Tax Income Composition Ratio of City Tax Income (CSV: 1KB)
(7) family register
The number of family register in Tsurumi Ward (permanent domicile) was 103,470 family register as of March 31, 2024, up 71 family register from the previous year. In addition, the number of households registered as residents in the ward is 153,599 (an increase of 1,854 from the previous year), ranking second among the 18 wards after Kohoku Ward, respectively.
No. 1 | 2nd place | 3rd place | |||
|---|---|---|---|---|---|
Kohoku Ward | 113,257 | Tsurumi Ward | 103,470 | Totsuka Ward | 91,084 |
No. 1 | 2nd place | 3rd place | |||
|---|---|---|---|---|---|
Kohoku Ward | 181,250 | Tsurumi Ward | 153,599 | Aoba Ward | 140,265 |
Materials: Tsurumi Ward Family Registry Division
Open data
Number of family register (permanent domicile) and number of registered households (CSV: 764 bytes)
(8) social security
As of April 2023, Tsurumi Ward has 5,222 households using social security and 6,557 people, the third largest among 18 wards after Naka Ward and Minami Ward, respectively.
As a recent trend, despite the prolonged COVID-19 pandemic, various measures for the poor living conditions have been taken, and the number of households in social security has started to decline without increasing. In addition, due to the aging of society, elderly households account for more than 50% of the households using them.
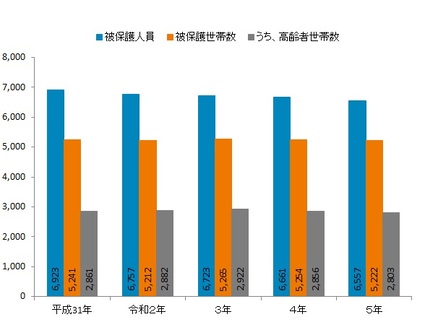 Number of social security Employees and Households (as of April of each year)
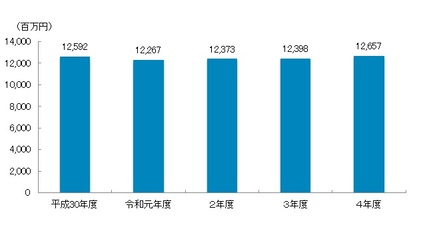 Changes in welfare expenses (financial settlements for each fiscal year)
Materials: Tsurumi Ward Life Support Division
Open data
social security Personnel, Number of Households and Welfare Expenses (CSV: 838 bytes)
(9) Child care
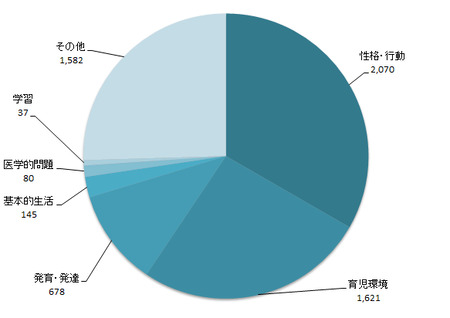
Child and Family Support Consultation Status (Total number of cases in FY2022, unit: case)
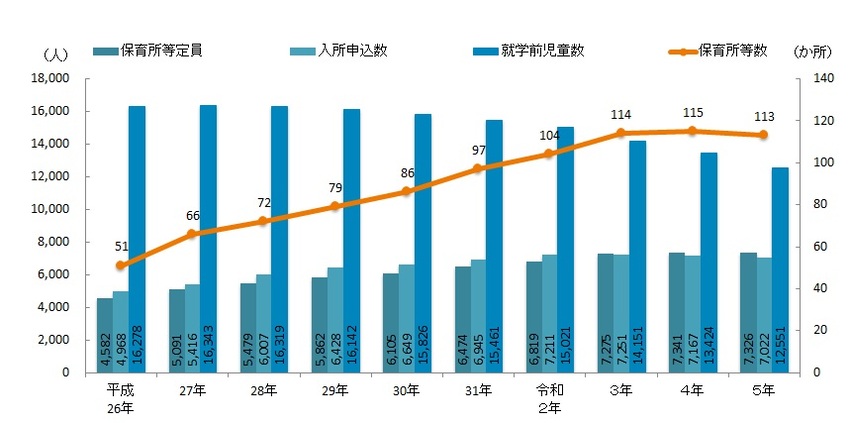
Usage status of daycare centers in Tsurumi Ward (as of April 1, each year)
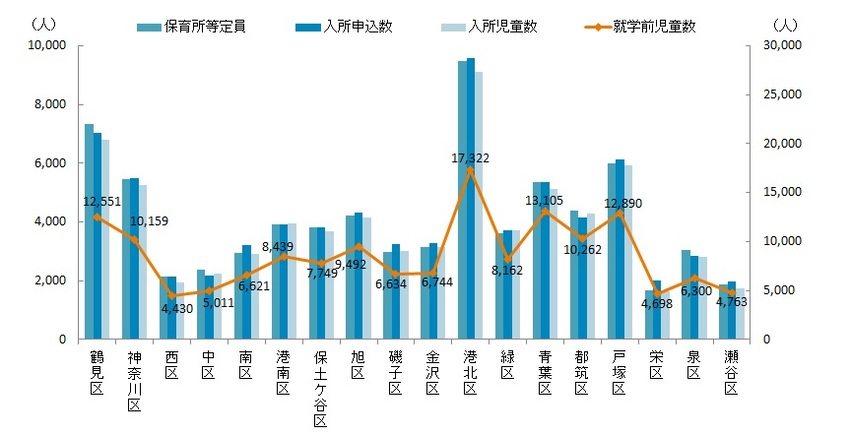
Number of pre-school children and daycare centers by 18 wards (as of April 1, 2023)
※Nursery schools, etc.: Includes daycare centers, certified children's centers, and community-based childcare (small-scale childcare, home-based childcare, in-house childcare).
Materials: Tsurumi Ward Children and Families Support Division
Open data
(10) Health
●Average life expectancy
Tsurumi Ward's average life expectancy and average independence period are 13th for men and 17th for women among the 18 wards.
| Average life expectancy | Average independence period | |||
|---|---|---|---|---|
| Men | Women | Men | Women | |
| Yokohama-shi | 81.97 | 87.71 | 80.25 | 84.16 |
| Tsurumi Ward | 81.12 | 86.62 | 79.25 | 82.81 |
| Kanagawa Ward | 81.85 | 87.89 | 80.06 | 84.19 |
| Nishi Ward | 80.69 | 86.99 | 79.03 | 83.40 |
| Naka Ward | 77.98 | 86.12 | 76.03 | 82.39 |
| Minami Ward | 79.85 | 86.67 | 78.11 | 82.86 |
| Konan Ward | 82.64 | 88.14 | 80.75 | 84.42 |
| Hodogaya Ward | 80.81 | 87.34 | 79.03 | 83.71 |
| Asahi Ward | 81.71 | 87.50 | 80.04 | 84.11 |
| Isogo Ward | 82.30 | 87.24 | 80.56 | 83.80 |
| Kanazawa Ward | 82.92 | 87.76 | 81.34 | 84.40 |
| Kohoku Ward | 82.47 | 87.94 | 80.71 | 84.27 |
| Midori Ward | 82.07 | 88.21 | 80.51 | 84.93 |
| Aoba Ward | 83.35 | 88.36 | 82.26 | 85.10 |
| Tsuzuki Ward | 83.85 | 89.41 | 82.08 | 85.81 |
| Totsuka Ward | 82.63 | 88.21 | 81.02 | 84.85 |
| Sakae Ward | 83.26 | 89.40 | 81.76 | 85.75 |
| Izumi Ward | 82.79 | 87.44 | 81.02 | 83.94 |
| Seya Ward | 80.60 | 87.38 | 78.96 | 83.61 |
※Average life expectancy: 0 years average life expectancy
※Average independence period: Average period during which care is not required in daily life
●Tuberculosis
The incidence of tuberculosis in Tsurumi Ward increased slightly between 2019 and 2020, but began to decrease again in 2021.
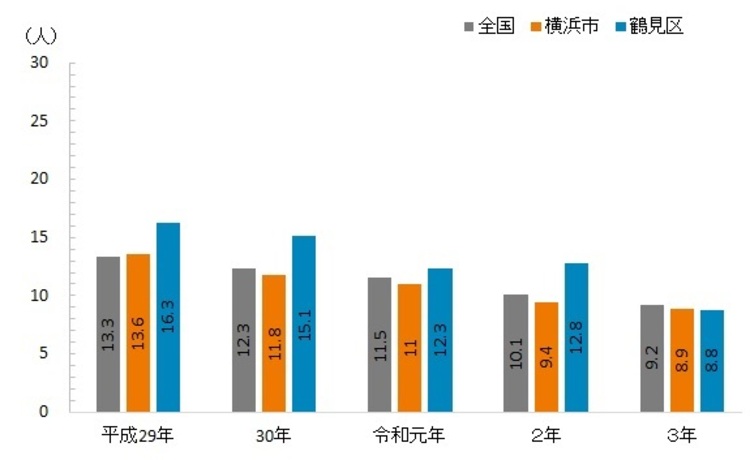
※Tuberculosis incidence is calculated by converting the number of new tuberculosis registrants per 100,000 population.
●Major causes of death
The main causes of death are malignant neoplasms (cancer), heart disease, and aging, in order of order, accounting for more than 50% of all causes of death.
| All Death Cause |
Evil Sex New Raw Goods |
Mind Sprint Disease |
Old man Decline |
Brain Blood Tubes Sprint Disease |
Lung Flame |
Not Consideration No A matter The reason |
Liver Sprint Disease |
Self Kill |
Renal Not All |
Stole Sex Closed Fortress Sex Lung Sprint Disease |
Yeah No Others |
|
|---|---|---|---|---|---|---|---|---|---|---|---|---|
| 2022 | 2,836 | 692 | 451 | 405 | 165 | 106 | 88 | 73 | 47 |
51 | 32 | 726 |
| 2021 | 2,528 | 716 | 369 | 310 | 196 | 89 | 88 | 57 | 43 | 43 | 33 | 584 |
| 2020 | 2,392 | 706 | 360 | 252 | 137 | 112 | 92 | 45 | 43 | 49 | 25 | 571 |
Materials: Tsurumi Ward Health and Welfare Division
Open data
Average life expectancy, tuberculosis, and major causes of death (CSV: 2KB)
(11) Elections
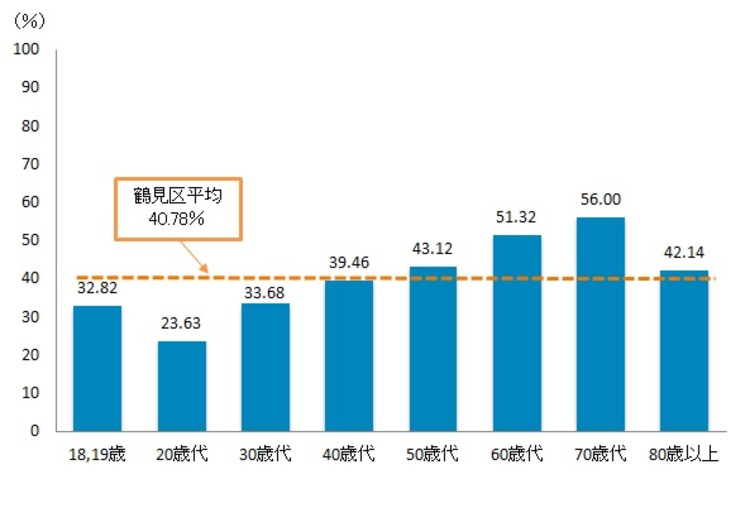
Tsurumi Ward's turnout has been sluggish, and in recent elections, both of which are below the Yokohama average. Looking at the turnout by age, the turnout in their twenties is the lowest, and improving the turnout, especially among young people, is an issue.
●Recent turnout
| Name of election | Election day | Turnout (%) | 18 ward middle ranking | |
|---|---|---|---|---|
| Tsurumi Ward | Yokohama-shi | |||
| Unified Local Elections (City Counsil) | April 9, 2023 | 40.78 |
42.83 | 15th place |
| Upper House regular election (constituencies) | July 10, 2022 | 52.05 | 55.36 | 17th place |
| House of Representatives general election (small constituencies) | October 31, 2021 | 51.63 | 56.07 | 18th place |
| The Mayor of Yokohama Election | August 22, 2021 | 44.18 | 49.05 | 18th place |
| Upper House regular election (constituencies) | July 21, 2019 | 46.58 | 49.70 | 17th place |
●Tsurumi Ward's turnout by age (the turnout by age of the 20th unified local election on April 9, 2023, City Counsil)
Open data
Recent turnout and age-specific turnout (CSV: 950 bytes)
About the use of open data
The open data posted on this page is provided under a Creative Commons Attribution 4.0 International License.
![]()
For details, please refer to the link below.
https://creativecommons.org/licenses/by/4.0/legalcode.ja (external site)
Inquiries to this page
General Affairs Division Statistics and Elections Section
Telephone: 045-510-1660
Telephone: 045-510-1660
Fax: 045-510-1889
Email address: tr-toukei@city.yokohama.jp
Page ID: 918-161-664


