


Here's the text.
2 Population
Last Updated July 1, 2024
(1) Trends in Population
●Population and Number of Households
After the war, the population, which had continued to increase, declined temporarily after peaking at 260,777 in July 1968, and fell to 229,945 in April 1981, but continued to increase thereafter, and in 2020, both population and households have reached a record high. As of December 1, 2023, the population of Tsurumi Ward is 295,724 and the number of households is 148,482.
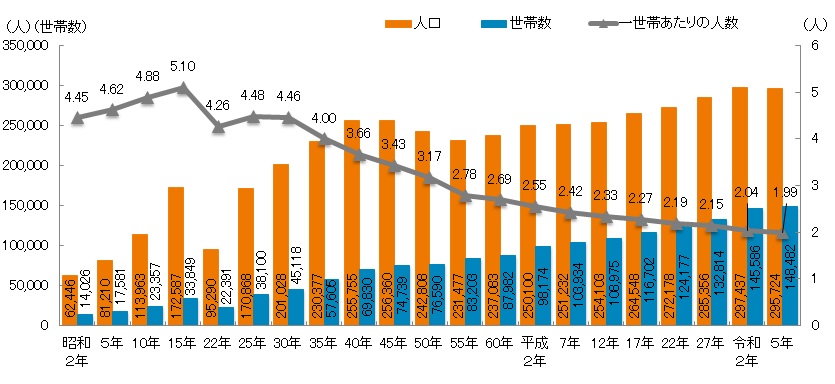
Materials: Census (estimated population as of October 1, 1927 as of December 31, 2023, estimated population as of December 1, 2023)
●Changes in Population Change, Social Change, and Natural Increase
The population of Tsurumi Ward has been changing rapidly. In the latter half of the 1940s, the population decreased significantly due to the fact that the number of migrants exceeded the number of migrants (social decline). Although the population increased due to the shift to social growth in the latter half of the 1950s, the social decline and the population continued to decline again in 1992 after the bubble period. Then, in 2000, society increased.·The trend of population growth continued, and in 2021 it turned to social decline and population decline, but in 2023 it was once again increasing in society and population. In addition, the number of fatalities has exceeded the number of births since 2018, turning to natural decline.
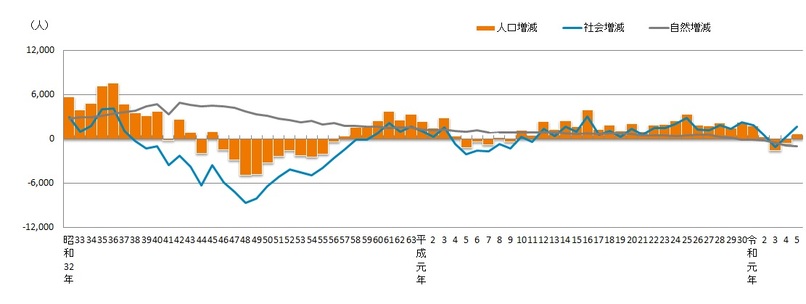
Tsurumi Ward
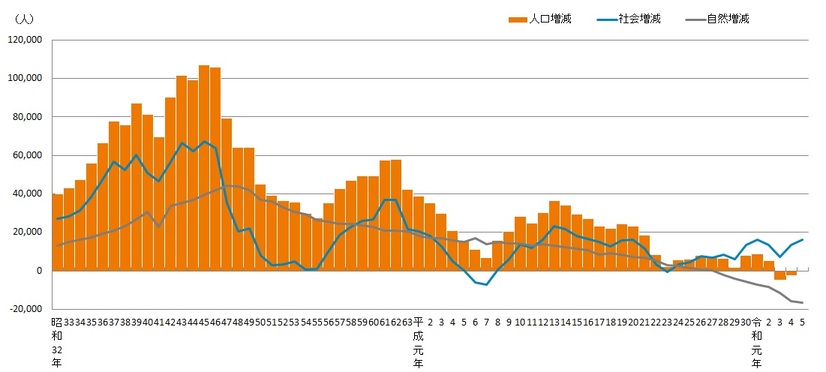
Yokohama-shi
Materials: Yokohama City Statistical Report and demographics of Yokohama and Population by Age
Open data
Changes in Population and Number of Households (CSV: 1KB)
Changes in Population Change, Social Change and Natural Increase (Tsurumi Ward) (CSV: 1KB)
Change of population change, social change, natural increase / decrease (Yokohama City) (CSV: 1KB)
(2) Population by age
●Population pyramid
One of the characteristics of the Tsurumi Ward's human ropyramid is that the birth rate declined before and after the end of World War II (★1), followed by the first baby boom (★2) and the second baby boom (★3). In addition, the large dent (★ 4) in the meantime has decreased birth due to noon in 1966 (Showa 41). In addition, the population during the second baby boom period in the late 40s depicts a mountain larger than the population during the first baby boom period in the early 70s.
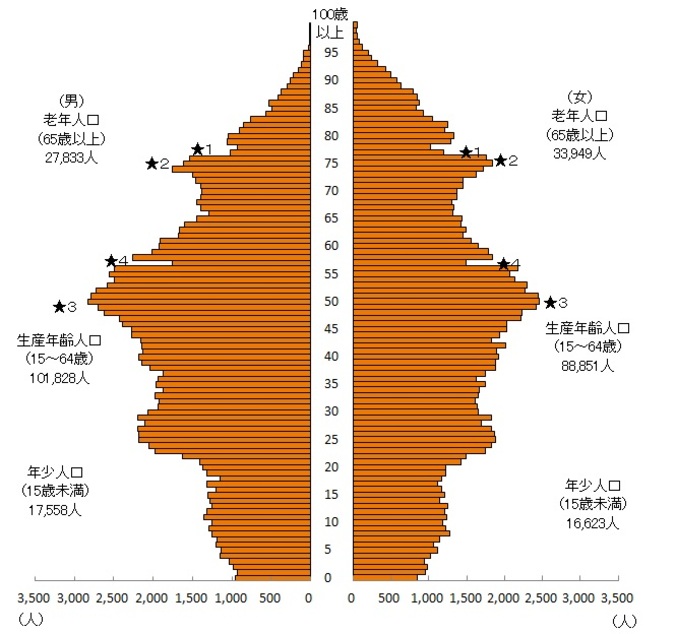
Tsurumi Ward Population Pyramid (as of January 1, 2024)
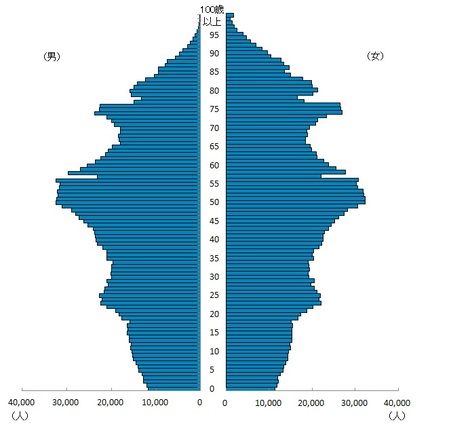 Yokohama City Population Pyramid (as of January 1, 2024)
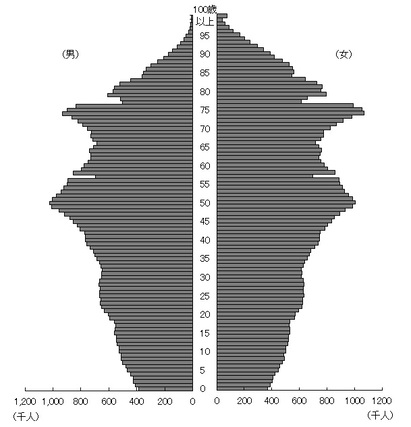 National Population Pyramid (as of October 1, 2023)
Materials: Population age of Yokohama (each age, 5 year old class), population by gender, Statistics Bureau, Ministry of Internal Affairs and Communications (each age), population by gender and demographic ratio-total population, Japanese population
●Number of population change, social change, and natural increase (during 2023)
| Population Change | Social Change | Natural change | |
|---|---|---|---|
| Tsurumi Ward | 667 | 1,633 | -966 |
| Yokohama-shi | -375 | 16,117 | -16,492 |
Materials: Yokohama City Statistical Report
●Average age by administrative division (as of January 1, 2024)
| Districts with low average age | Ranking | Districts with high average age | ||
|---|---|---|---|---|
| Tsuzuki Ward | 44.28 | No. 1 | Sakae Ward | 49.93 |
| Kohoku Ward | 44.31 | 2nd place | Kanazawa Ward | 49.77 |
| Nishi Ward | 44.62 | 3rd place | Asahi Ward | 49.62 |
| Tsurumi Ward | 45.05 | No. 4 | Konan Ward | 49.28 |
Materials: Population of Yokohama, male and female, administrative district, age group divided population, age composition index and average age
●Changes in population by age group (Tsurumi Ward)
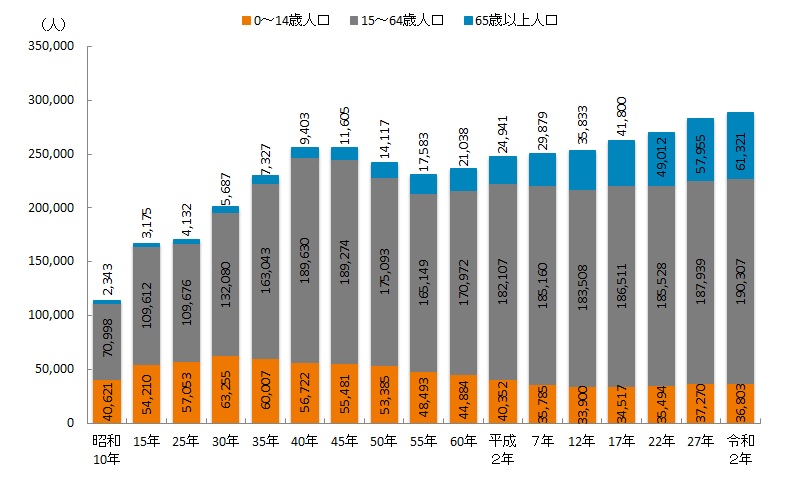
Looking at the population by age group, the elderly population is increasing, and in 2000, the young population under the age of 15 and the elderly population over the age of 65 were reversed, and the difference tends to spread in recent years .
※Excluding age "unknown"
Materials: Census (as of October 1, each year)
●Tsurumi-Young, working age, old age population ratio and population density as seen on the map-
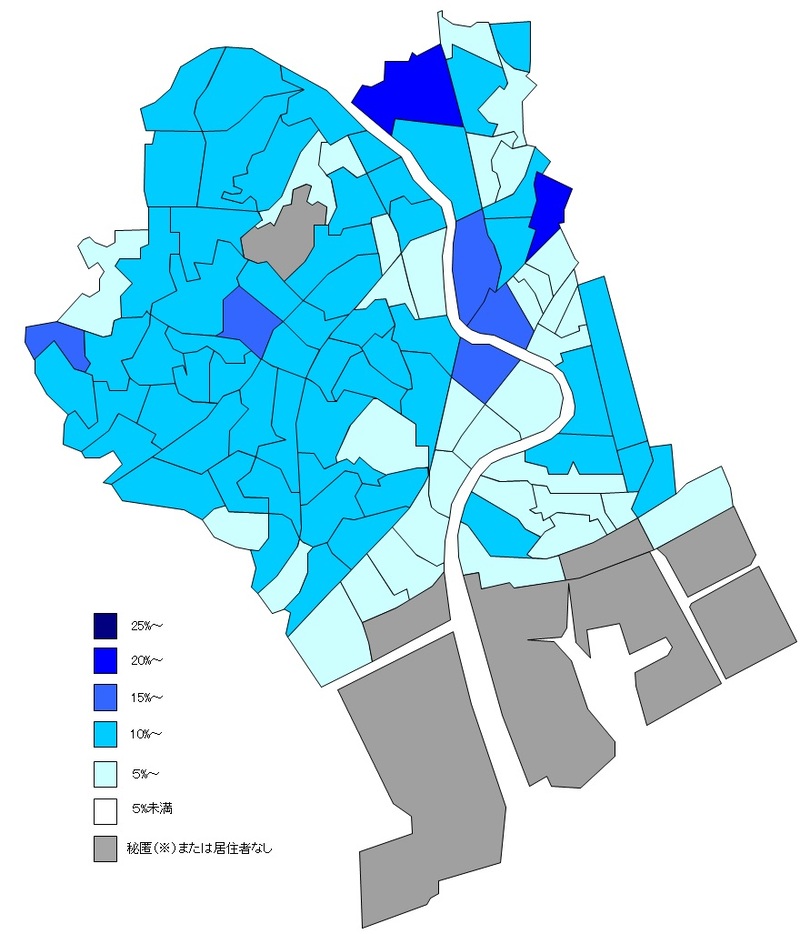
Ratio of young population (under 15 years old)
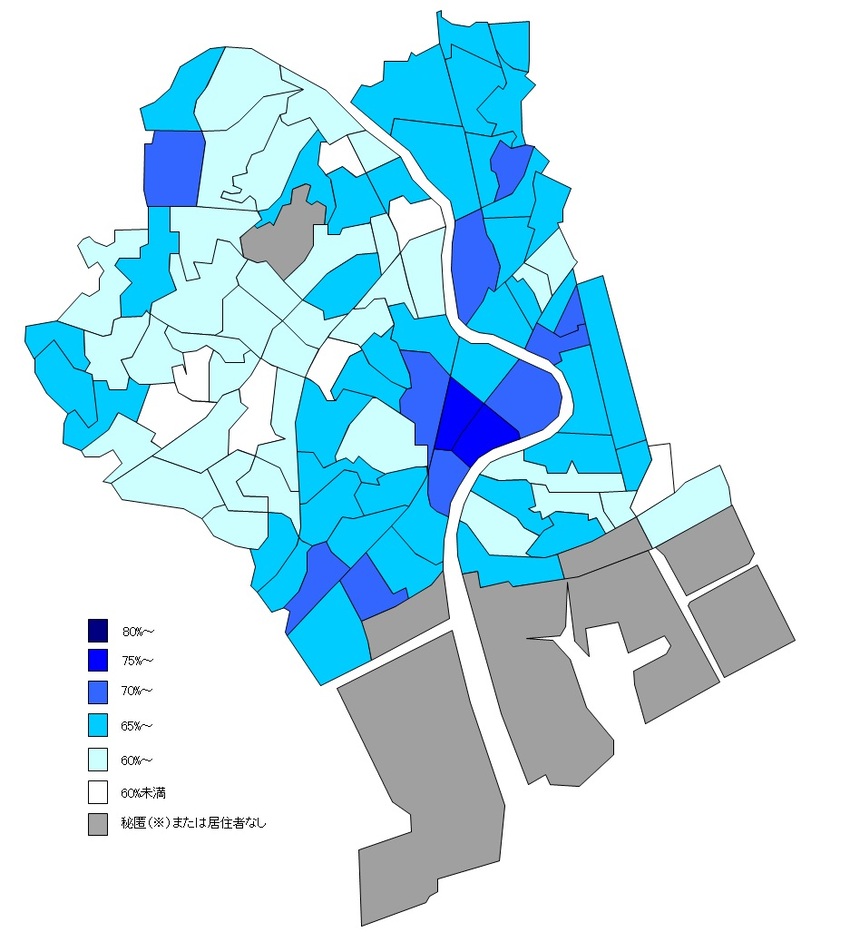
Working-age population (15-64 years old) Population ratio
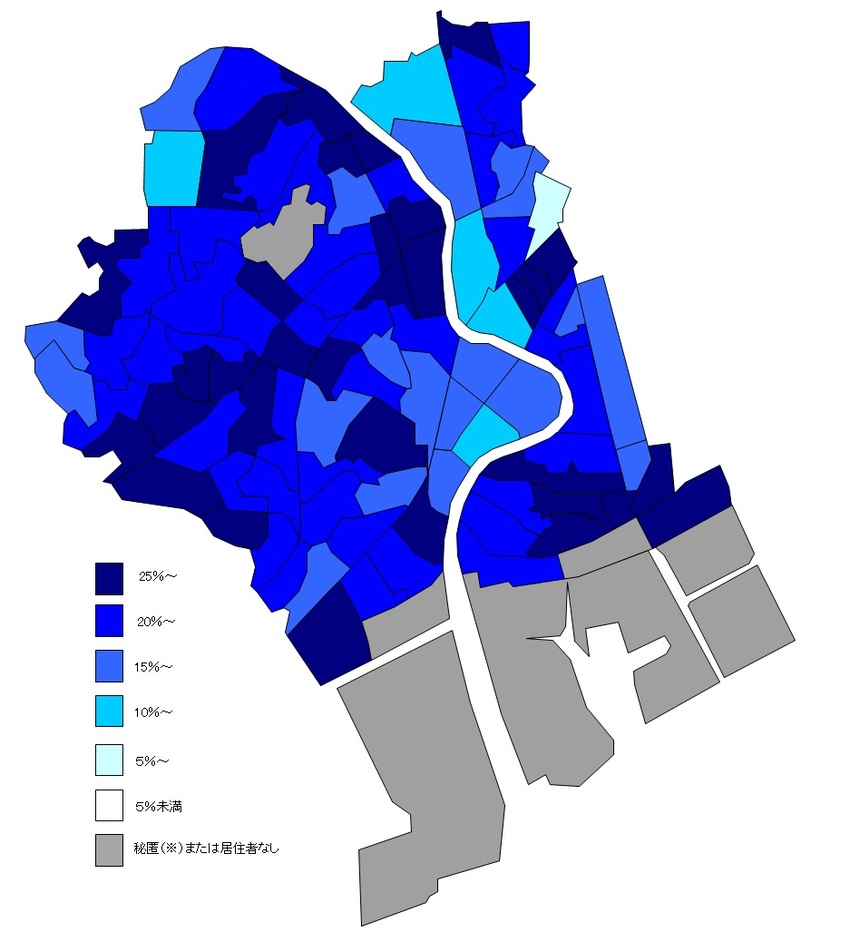
Percentage of elderly population (aged 65 and over)
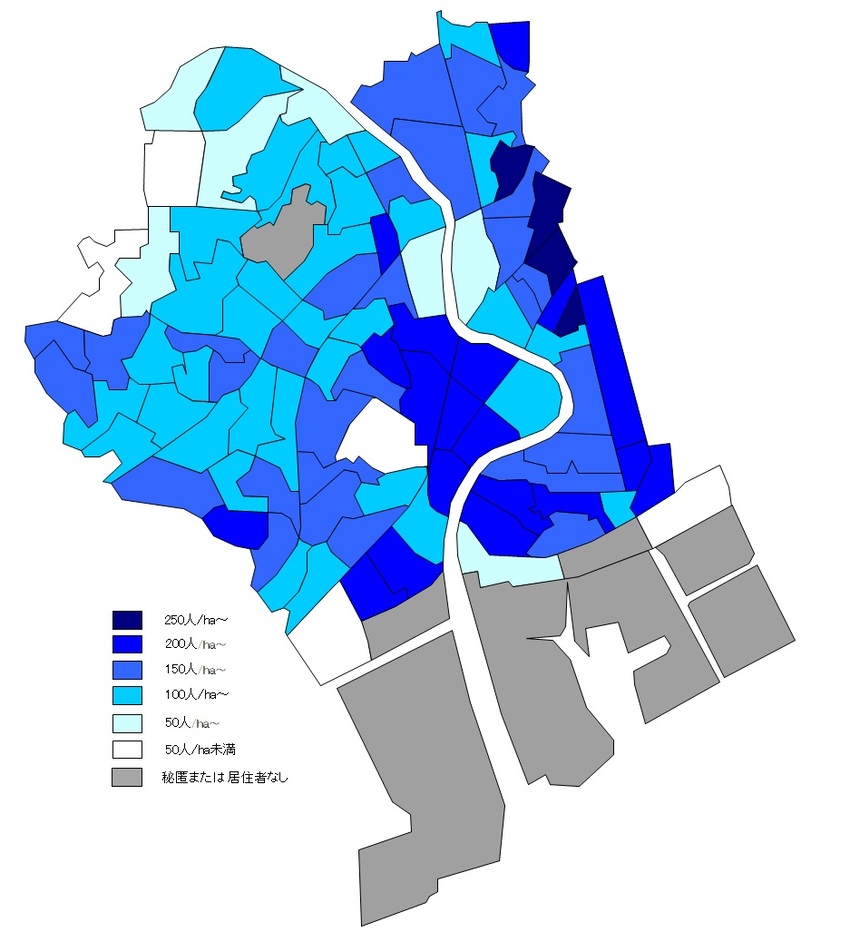
Population density by town in Tsurumi Ward
The densely populated towns in Tsurumi Ward are Shirite 1-chome, Shirite 3-chome, Ichibafujimicho, Ichibakamicho and Honchodori. In addition, the population density around Tsurumi Station and the city border between Kawasaki City tends to be high.
※Daikoku futo and Ougishima are omitted.
※Anything that may identify an individual by showing the data is referred to as "secure".
Materials: Basic Resident Register (as of September 30, 2023) and Yokohama Municipal Area Handbook (as of June 2016), Civic Affairs Bureau
Open data
Tsurumi Ward Population Pyramid (CSV: 2KB)
Yokohama City Population Pyramid (CSV: 2KB)
National Population Pyramid (CSV: 1KB)
Number of population change, social change, natural increase / decrease (CSV: 249 bytes)
Average age by administrative division (CSV: 486 bytes)
Changes in population by age group (CSV: 776 bytes)
Tsurumi-Young population (under 15 years old) population ratio as seen on the map-(CSV: 3KB)
Tsurumi-Productive-age population (15-64 years old) population ratio-(CSV: 3KB)
Tsurumi-Elderly Population (65 years and older) Population Ratio as seen on the map-(CSV: 3KB)
Tsurumi-population density as seen on a map-(CSV: 2KB)
(3) Foreign residents
●Foreign Residents
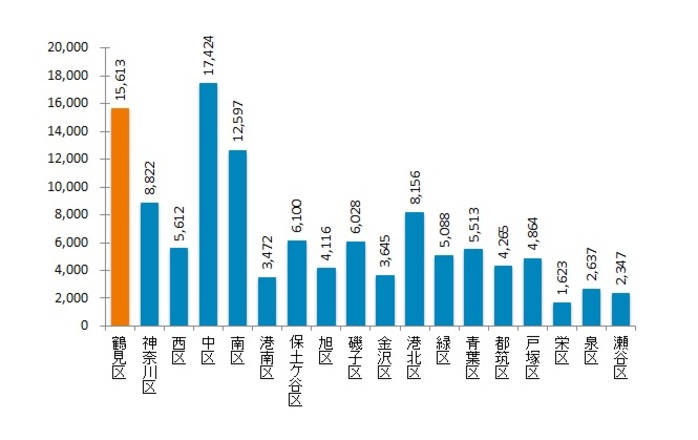
As of March 31, 2024, there were 15,613 foreign residents living in Tsurumi Ward (an increase of 1,485 from the previous year). This is the second largest number in the city following Naka Ward.
Materials: Yokohama City Statistical Report (as of March 31, 2024)
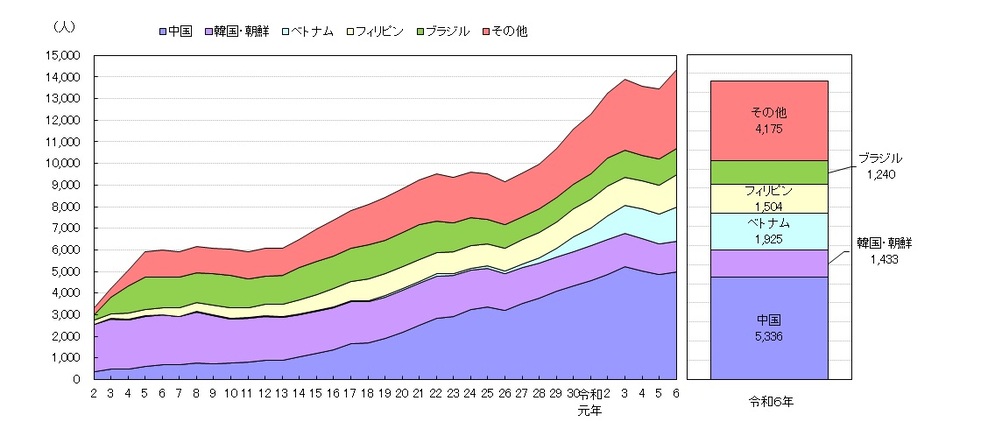
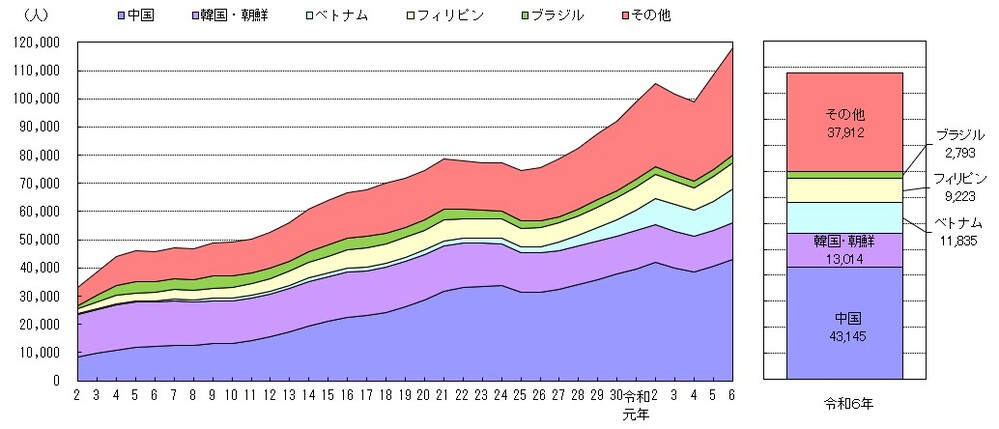
●Number of Foreign Residents by Nationality
Tsurumi Ward
Yokohama-shi
The number of foreign residents in Tsurumi Ward by nationality is as follows: China, Vietnam, the Philippines, Korea and Korea, and Brazil. Compared to Yokohama City as a whole, Tsurumi Ward has a larger percentage of Brazilian nationals.
Materials: Yokohama City Statistical Report and Basic Resident Register Foreign Population (as of the end of March each year)
Open data
Foreign residents (CSV: 628 bytes)
Trends in the Number of Foreign Residents by Nationality (Tsurumi Ward) (CSV: 2KB)
Trends in the Number of Foreign Residents by Nationality (Yokohama City) (CSV: 1KB)
(4) Employment status, labor force and labor force ratio
●Employment status (Unit: People)
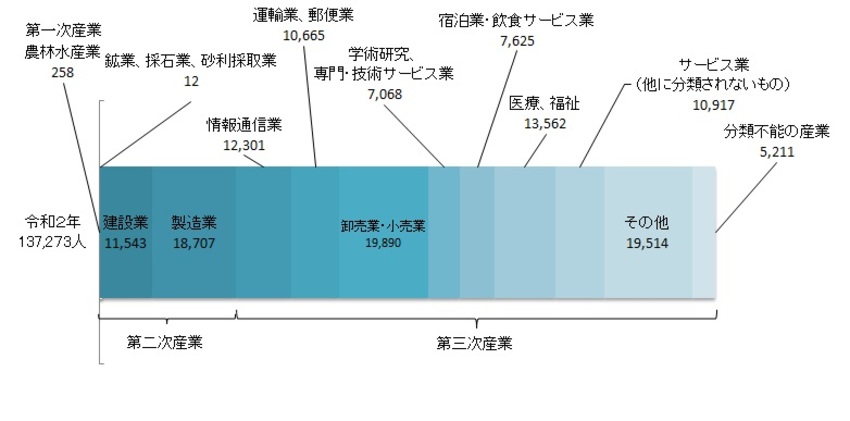
Tsurumi Ward has the largest number of workers in the tertiary, secondary and primary industries, with the largest number of workers in wholesale and retail industries at 19,890.
Materials: 2020 National Census
●Labor force and labor force ratio
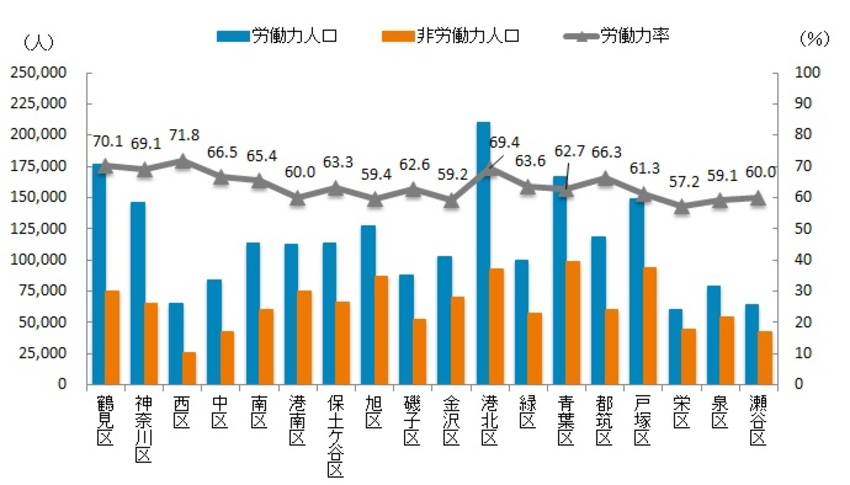
Tsurumi Ward's workforce is 176,428, the second largest after Kohoku Ward. Tsurumi Ward's labor force ratio is 70.1%, ranking second among the 18 wards.
※Labor force ratio = Percentage of the working population (total of employed and unemployed) to those aged 15 and over
※Based on unknown complementary value
Materials: 2020 National Census
Open data
Employment status (CSV: 570 bytes)
Labor force and labor force ratio (CSV: 887 bytes)
(5) Outflow and inflow population, daytime and nighttime population
●Outflow and inflow population
| Outflow population (person) | Influx population (person) | |
|---|---|---|
Tokyo (including special wards) |
57,228(54,884) |
10,495(8,522) |
| Kawasaki-shi | 27,025 | 16,276 |
Yokohama City (excluding Tsurumi Ward) |
29,259 | 36,273 |
| Working and attending school in Tsurumi Ward with Tsurumi residents | 83,072 | 83,072 |
| Others | 6,070 | 13,077 |
The number of employees and students aged 15 and over who live in Tsurumi Ward is 202,654, of which 83,072 (41.0%) work or go to school in other wards of Yokohama, accounting for 29,259 (14.4%). Outside Yokohama City, 57,228 people (28.2%) work or go to Tokyo.
※Based on unknown complementary value
Materials: 2020 National Census
●Day and night population
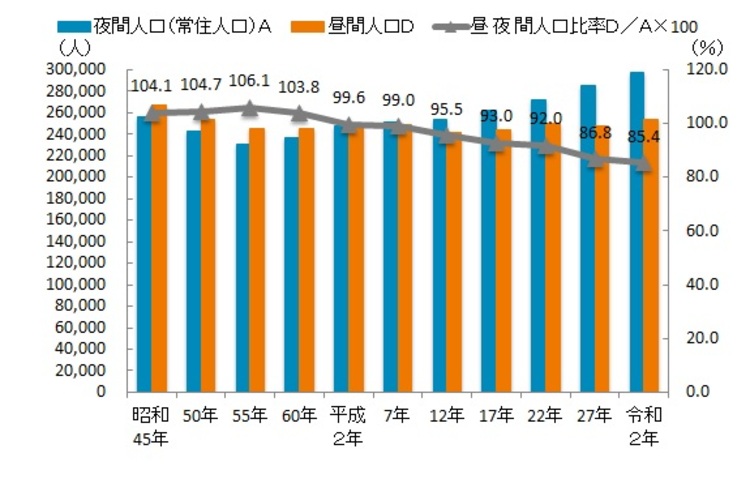
In 2020, the daytime population of Tsurumi Ward was 253,976 and nighttime population was 297,437. Since 1990, the nighttime population has exceeded the daytime population. In addition, the daytime and nighttime population ratio was 85.4%, peaking at 106.1% in 1980, and continues to decline.
※Based on unknown complementary value
Materials: 2020 National Census
Open data
Outflow and inflow population (CSV: 592 bytes)
Day and night population (CSV: 696 bytes)
About the use of open data
The open data posted on this page is provided under a Creative Commons Attribution 4.0 International License.
![]()
For details, please refer to the link below.
https://creativecommons.org/licenses/by/4.0/legalcode.ja (external site)
Inquiries to this page
General Affairs Division Statistics and Elections Section
Telephone: 045-510-1660
Telephone: 045-510-1660
Fax: 045-510-1889
Email address: tr-toukei@city.yokohama.jp
Page ID: 598-518-224


