- Yokohama-shi Top Page
- Health, Medical and Welfare
- Health and Medical Care
- institute for health
- Health Information
- Health Epidemiological Statistics Data
- Average life expectancy and healthy life expectancy in Yokohama City
Here's the text.
Average life expectancy and healthy life expectancy in Yokohama City
Last Updated March 18, 2019
Changes in healthy life expectancy and average life expectancy
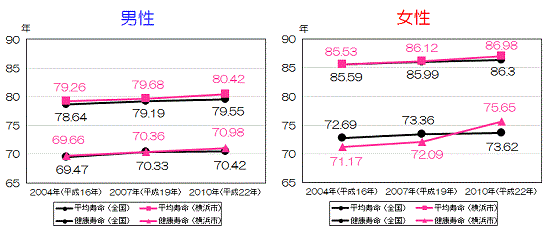
Healthy life expectancy was calculated based on the population and the number of deaths based on the data for Yokohama City in the Basic Survey on National Life conducted by the Ministry of Health, Labour and Welfare every three years.
Looking at the changes in healthy life expectancy and average life expectancy (Table 1), the healthy life expectancy in 2010 (the period during which daily life can be restricted due to health problems) is 70.98 for men and women 75.65 years. Compared to the whole country, both men and women are higher than the national value (male: 70.42, female: 73.62).
| Men | Women | |||||||
|---|---|---|---|---|---|---|---|---|
| Average life expectancy (nationwide) | Average life expectancy (Yokohama City) | Healthy life expectancy (nationwide) | Healthy life expectancy (Yokohama City) | Average life expectancy (nationwide) | Average life expectancy (Yokohama City) | Healthy life expectancy (nationwide) | Healthy life expectancy (Yokohama City) | |
2004 | 78.64 | 79.26 | 69.47 | 69.66 | 85.59 | 85.53 | 72.69 | 71.17 |
2007 | 79.19 | 79.68 | 70.33 | 70.36 | 85.99 | 86.12 | 73.36 | 72.09 |
2010 | 79.55 | 80.42 | 70.42 | 70.98 | 86.30 | 86.98 | 73.62 | 75.65 |

| Population | Number of deaths | |
|---|---|---|
| 2004 | 2004 by demographic age (5-year-old class) | 2004 by demographic and age (5-year-old class) |
| 2007 | 2007 by demographic age (5-year-old class) | 2007 by demographics and age (5-year-old class) |
| 2010 | 2010 Census Age (5-year-old class) | 2010 by demographics and age (5-year-old class) |
Difference between average life expectancy and healthy life expectancy
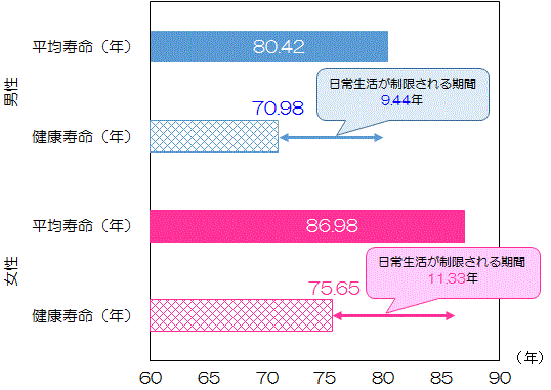
The difference between the average life expectancy and healthy life expectancy in 2010 (the period during which daily life is restricted) (Table 2) is 9.44 for men and 11.33 for women.
In future health measures, it is important not only to extend the life expectancy but also to extend the healthy life expectancy.
The challenge is how to reduce the difference between average life expectancy and healthy life expectancy.
We found that women were 1.89 (11.33-9.44) years longer than men.
| Men | Women | Gender differences | |
|---|---|---|---|
| Average life expectancy (year) | 80.42 | 86.98 | 6.56 |
| Healthy life expectancy (year) | 70.98 | 75.65 | 4.67 |
| Difference between average life expectancy and healthy life expectancy (year) | 9.44 | 11.33 | 1.89 |

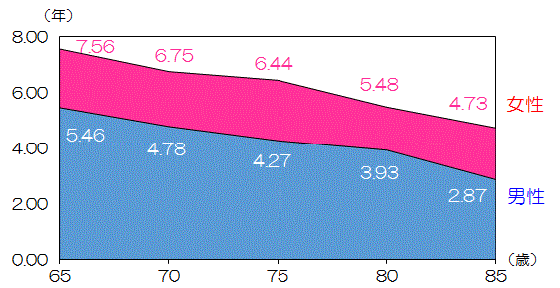
In 2010, the period during which daily life is restricted for those aged 65 and over (Table 3) was 5.46 years for men aged 65 and 7.56 years for women, about 1.4 times longer than for men, 85 years for men and 4.73 years for women, about 1.6 times that for men.
| Men | Women | Gender differences | Female/male | |
|---|---|---|---|---|
| 65 years old | 5.46 | 7.56 | 2.10 | 1.4 times |
| 70 years old | 4.78 | 6.75 | 1.97 | 1.4 times |
| 75 years old | 4.27 | 6.44 | 2.17 | 1.5 times |
| 80 years old | 3.93 | 5.48 | 1.55 | 1.4 times |
| 85 years old | 2.87 | 4.73 | 1.86 | 1.6 times |

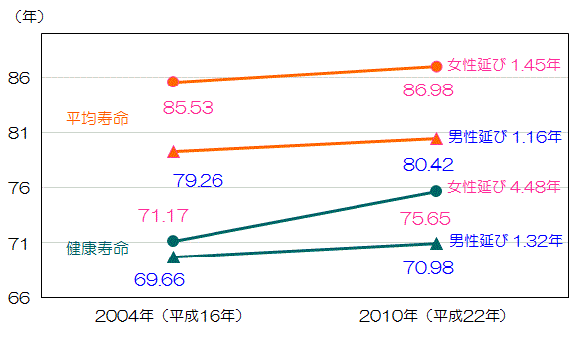
Comparing healthy life expectancy in 2004 and 22 years (Table 4), men increased by 1.32 years from 69.66 to 70.98, and women increased by 4.48 years from 71.17 to 75.65.
The average life expectancy at the same time was increased by 1.16 years for men and 1.45 years for women, and the increase in healthy life expectancy was greater than the increase in average life expectancy.
| Healthy life expectancy | Average life expectancy | |||
|---|---|---|---|---|
| Men | Women | Men | Women | |
| 2004 (Heisei 16) | 69.66 | 71.17 | 79.26 | 85.53 |
| 2010 (Heisei 22) | 70.98 | 75.65 | 80.42 | 86.98 |
| Comparison between 2004 and 2010 (extending) | 1.32 | 4.48 | 1.16 | 1.45 |

Inquiries to this page
Infectious Diseases and Epidemiology Information Division, Medical Care Bureau Institute of Health
Telephone: 045-370-9237
Telephone: 045-370-9237
Fax: 045-370-8462
Email address: ir-eiken@city.yokohama.lg.jp
Page ID: 289-104-581


