


Here's the text.
Green Data
Last Updated March 31, 2020
About findings of green coverage ratio in 2019
Yokohama City surveys the green coverage approximately every five years with the aim of grasping the change in the total amount of greenery in the medium to long term.
This time, we report the results of the survey of green coverage in FY2019.
Green coverage of the entire city of Yokohama
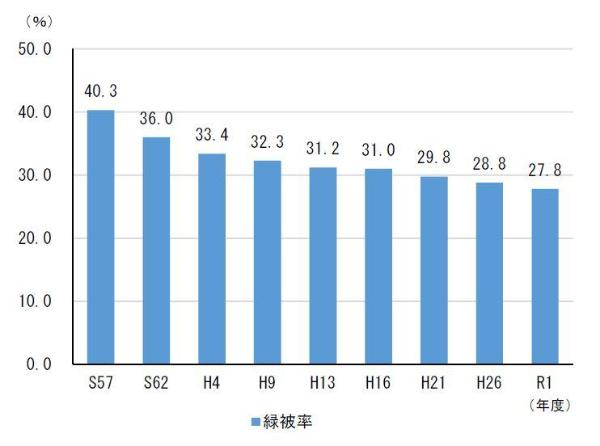
The change in green coverage is considered as a rough trend because the survey method and accuracy differ depending on the survey year.
Green coverage of distinction
| Name of ward | 2004 | 2009 | 2014 | 2019 |
|---|---|---|---|---|
| Tsurumi Ward | 14.7 | 13.7 | 13.1 | 12.7 |
| Kanagawa Ward | 23.5 | 22.6 | 22.0 | 21.4 |
| Nishi Ward | 13.1 | 11.2 | 11.6 | 11.3 |
| Naka Ward | 15.2 | 14.3 | 14.0 | 13.4 |
| Minami Ward | 16.0 | 15.4 | 14.4 | 14.1 |
| Konan Ward | 23.0 | 22.9 | 22.1 | 21.1 |
| Hodogaya Ward | 32.2 | 31.1 | 30.0 | 29.4 |
| Asahi Ward | 37.1 | 36.0 | 35.0 | 33.9 |
| Isogo Ward | 27.8 | 27.6 | 26.9 | 26.6 |
| Kanazawa Ward | 31.8 | 31.8 | 31.5 | 31.0 |
| Kohoku Ward | 27.8 | 26.5 | 25.1 | 24.1 |
| Midori Ward | 44.3 | 42.8 | 41.4 | 40.6 |
| Aoba Ward | 34.0 | 31.4 | 30.0 | 28.8 |
| Tsuzuki Ward | 36.1 | 33.6 | 31.8 | 30.0 |
| Totsuka Ward | 39.0 | 37.8 | 36.5 | 35.0 |
| Sakae Ward | 42.1 | 41.8 | 40.6 | 38.8 |
| Izumi Ward | 41.1 | 39.0 | 37.6 | 36.3 |
| Seya Ward | 35.9 | 35.1 | 34.0 | 32.9 |
| Total city | 31.0 | 29.8 | 28.8 | 27.8 |
※The value is rounded to the second decimal place.
What is green coverage?
It visually reads a cohesive green of 300m2 or more from aerial photographs and calculates the ratio to the city area.
Results of the survey
About findings of green coverage ratio in 2019 (PDF: 548KB)
[Survey Results]
・Green cover area and green coverage
・More than 10m2 green cover area and 10m2 green coverage ratio
・Green cover area and green coverage ratio
・Green cover area and green coverage by urbanization area / urbanization adjustment area
・Green cover area and green coverage by restricted zone
・Green cover area of 10 m2 or more and green coverage of 10 m2 or more
・Green cover area of 10m2 or more according to urbanization area / urbanization adjustment area and green coverage of 10m2 or more
・Green cover area of 10 m2 or more by restricted zone and green coverage of 10 m2 or more
About green coverage map
2019 Green Cover Distribution Map (PDF: 330KB)
You may need a separate PDF reader to open a PDF file.
If you do not have it, you can download it free of charge from Adobe.
![]() To download Adobe Acrobat Reader DC
To download Adobe Acrobat Reader DC
Inquiries to this page
Strategic Planning Division, Strategic Planning Department, Green Environment Bureau
Telephone: 045-671-4214
Telephone: 045-671-4214
Fax: 045-550-4093
Email address: mk-mimiplan@city.yokohama.lg.jp
Page ID: 248-114-811


