


- Yokohama-shi Top Page
- Living and Procedures
- Community Development and Environment
- Environmental Conservation
- Survey and observation
- Institute for Environmental Science
- Environmental measurement data
- Observation results of groundwater level and ground shrinkage
Here's the text.
Observation results of groundwater level and ground shrinkage
Last Updated October 28, 2024
The Institute of Environmental Science conducts observations of groundwater levels and ground shrinkage in the city.
On this page, we will tell you about the observation results that are performed once a month at each observation point.
Underground water level and ground contraction amount observed by the Institute for Environmental Science
The Institute for Environmental Science observes groundwater levels at 10 groundwater observation wells in the city with the aim of preventing land subsidence in soft ground areas. In addition, we are observing the amount of ground shrinkage at seven of these locations.
Survey points
The survey points are as shown in the figure below.
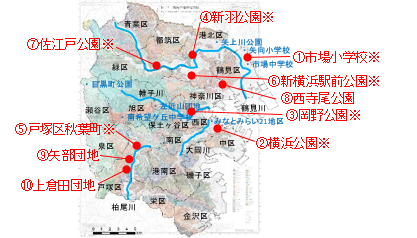
Observation location map
Name of observation location
- Ground water level observation point (* The ground contraction amount is also observed.)
- Market Elementary School ※Yokohama Park ※Okano Koen ※Niwa Park ※Akibacho, Totsuka-ku ※Shin-Yokohama Ekimae Park ※Saedo Park ※Nishiterao Park, Yabe housing complex, Kami Kurata housing complex (10 observation wells: 14 observation wells)
- Locations where groundwater observation is performed simply (blue)
- Market Junior High School, Yako Elementary School, Minato Mirai 21 District, Sakonyama housing complex, Minamikibogaoka Junior High School, Yagami River Park, Megurocho Park
Results of the survey
Observation results of groundwater level and ground change
Observation results for FY2023 (FY2023)
| Observation point name | Water level fluctuation (m) | Ground shrinkage (mm) |
|---|---|---|
| Market Elementary School (66m) | 0.14 |
-0.36 |
| Yokohama Park (57m) | 0.03 | -0.43 |
| Okano Koen (32m) | 0.05 | -0.63 |
| Niwa Park -1 (80m) | 0.48 | -0.72 |
| Niwa Park -2 (40m) | 0.35 | -0.76 |
| Akiba-cho, Totsuka-ku (150m) | 0.03 | -0.51 |
| Shin-Yokohama Ekimae Park -1 (25m) | 0.31 | -0.30 |
| Shin-Yokohama Ekimae Park -2 (70m) | 0.32 | -0.94 |
| Shin-Yokohama Ekimae Park -3 (117m) | 0.24 | -1.55 |
| Saedo Park -1 (16m) | 0.44 | 1.23※ |
| Saedo Park -2 (88m) | 0.87 | -1.22 |
| Nishiterao Park (17m) | -0.13 | Observation of groundwater level only |
| housing complex Yabe (10m) | 0.20 | Observation of groundwater level only |
| Kami Kurata housing complex (15m) | 0.48 | Observation of groundwater level only |
- The numbers in parentheses of the observation point name indicate the depth of the well.
- The groundwater level fluctuation is the change in the groundwater level in March of the observation year compared to March of the previous year.
- The ground contraction amount is the change in the height of the ground surface in March of the observation year compared to March of the previous year. The minus (-) of the value indicates the contraction. ※Regarding the ground fluctuation amount of Saedo Park-1 (16m), the height of the ground surface in March of the observation year compared to January of the observation year.
Observation records at each observatory
Reiwa 5 (2023) Ground water level and ground shrinkage observation graph (PDF: 841KB)
Reiwa 5 (2023) Simple groundwater level observation graph (PDF: 562KB)
Reiwa 5 (2023) Observation Data Table (PDF: 112KB)
Previous year observation records
Underground water level and ground shrinkage observation graph from April 2018 (April 2018) to March 2024 (Reiwa 6)
You may need a separate PDF reader to open a PDF file.
If you do not have it, you can download it free of charge from Adobe.
![]() To download Adobe Acrobat Reader DC
To download Adobe Acrobat Reader DC
Inquiries to this page
Environmental Science Research Institute, Environmental Conservation Department, Green Environment Bureau
Telephone: 045-453-2550
Telephone: 045-453-2550
Fax: 045-453-2560
Email address: mk-kanken@city.yokohama.lg.jp
Page ID: 491-330-763


