


- Yokohama-shi Top Page
- Health, Medical and Welfare
- Health and Medical Care
- Vaccinations Infectious Diseases
- Infectious diseases
- COVID-19
- Various data related to COVID-19 infection
- Archive data related to COVID-19 infection (until May 7, 2023)
Here's the text.
Archive data related to COVID-19 infection (until May 7, 2023)
Last Updated October 30, 2024
Contents
[Data as of May 7, 2023]
[Data as of September 26, 2022]
Status of Positive Patients (data until May 7, 2023)
Data up to the 5th change of COVID-19 infection will be posted.
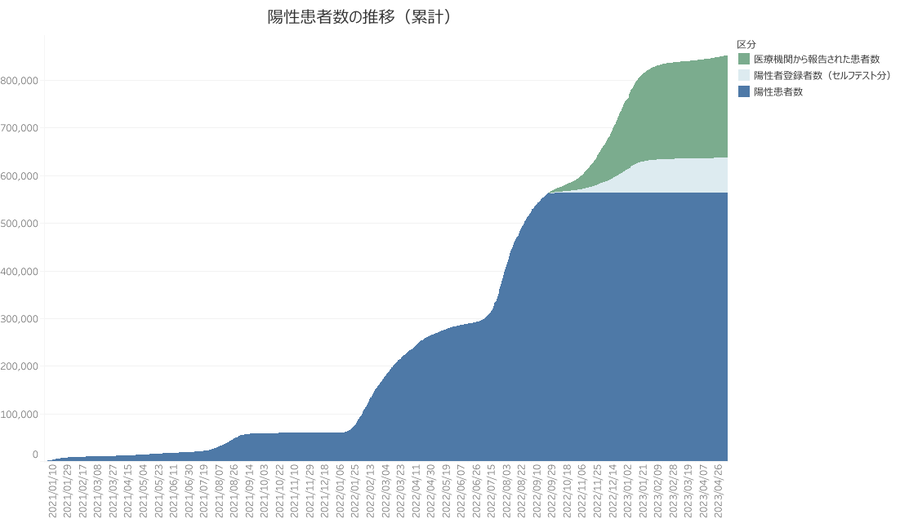
Trends in Positive Patients As of May 7, 2023
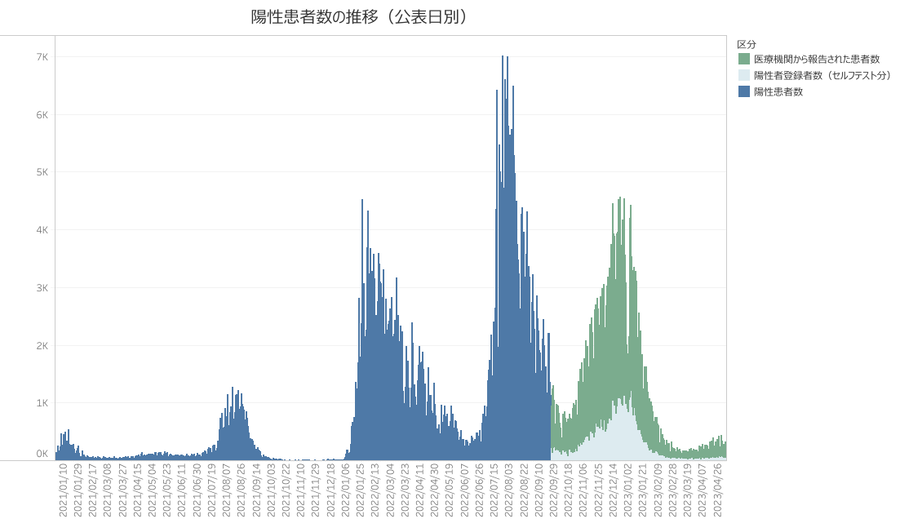
Number of patients reported by medical institutions Total of 123 per day: 787,439
Number of positive registrants (self-test) 77 people per day cumulative total of 74,370 people
Total of 200 people by day Total 861,809 people
Trends in the percentage of positive patients by age As of May 7, 2023
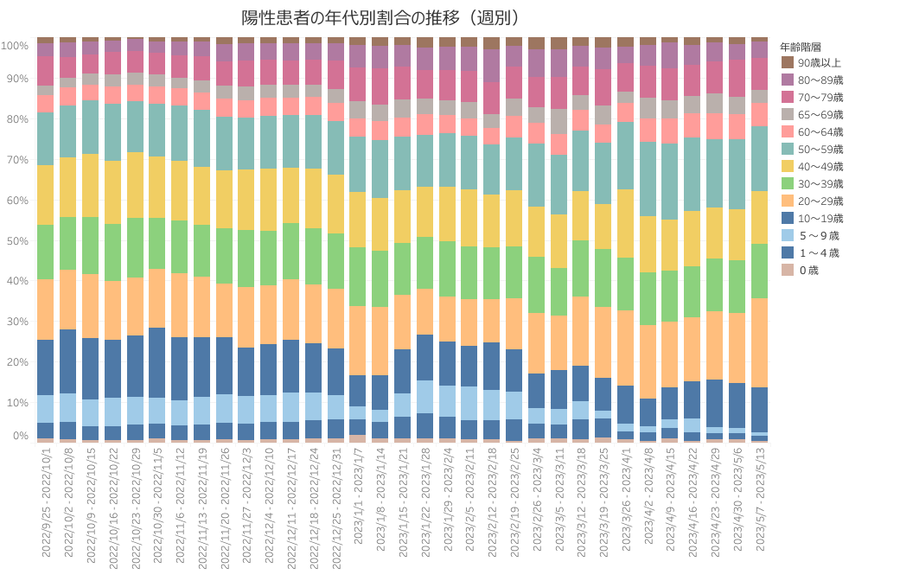
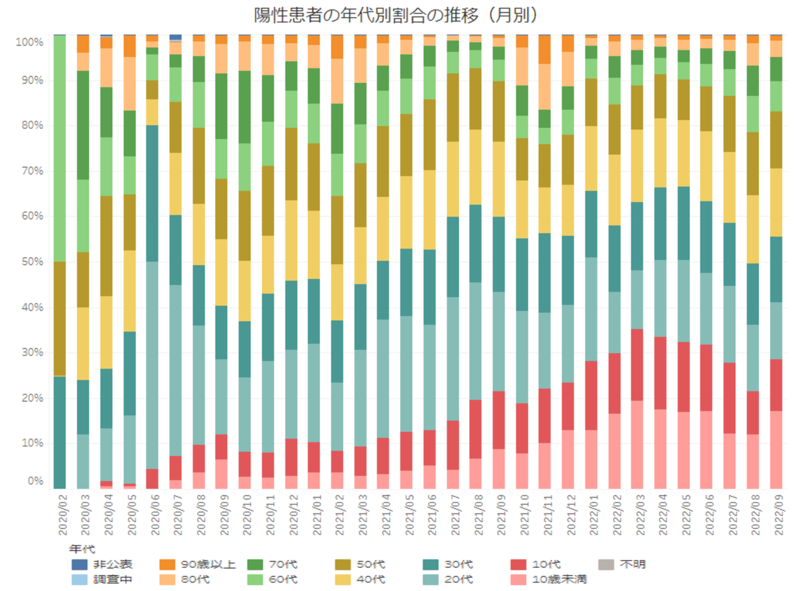
For the period from “2022/9/25 to 2022/10/1” in the bar chart, the figures for “2022/9/27 to 2022/10/1” are calculated based on the date of the review of the total number.
Status of inpatients and recuperators and the number of deaths as of May 7, 2023
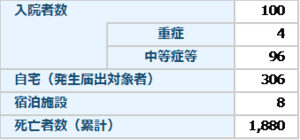
(Note) The number of hospitalized patients is the number of beds used reported by the receiving medical institution for positive patients. Including residents living outside the city. Excludes medical institutions secured by the prefecture and temporary medical facilities.
Status of recuperation at home and accommodation facilities As of May 7, 2023
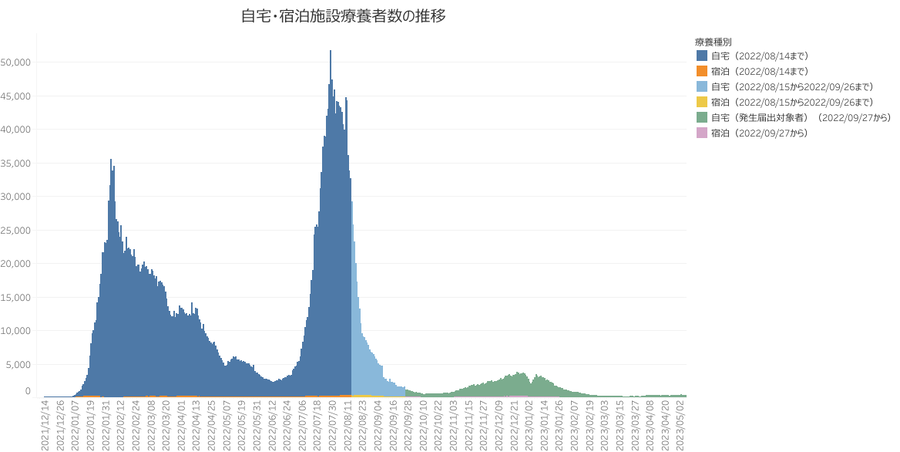
From December 8, 2021, we started counting the number of home and accommodation recuperation patients.
From August 15, 2022 (Monday), the number of people subject to health observation has been counted.
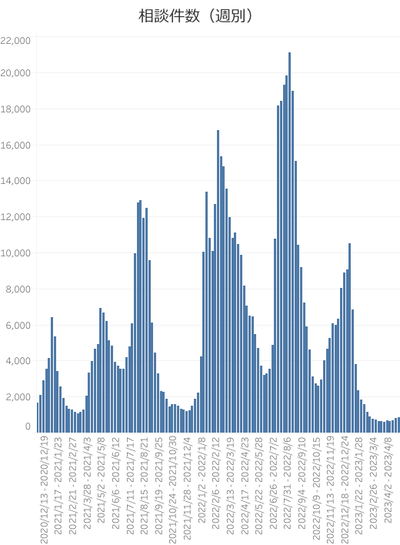
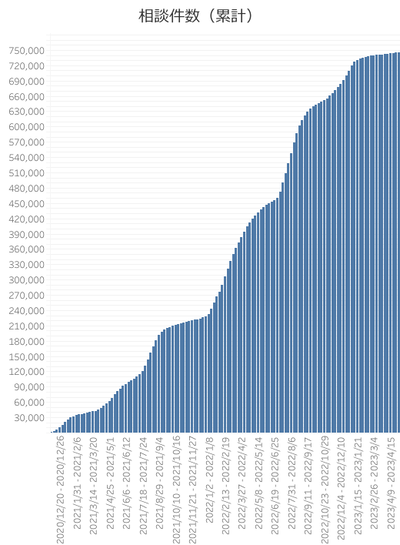
Number of call center consultations as of May 7, 2023
From December 1, 2020, the Yokohama City COVID-19 Infectious Disease Call Center and the Returnee / Contact Consultation Center have been unified, and the 24-hour shift has been made to a separate graph.
after December 1, 2020
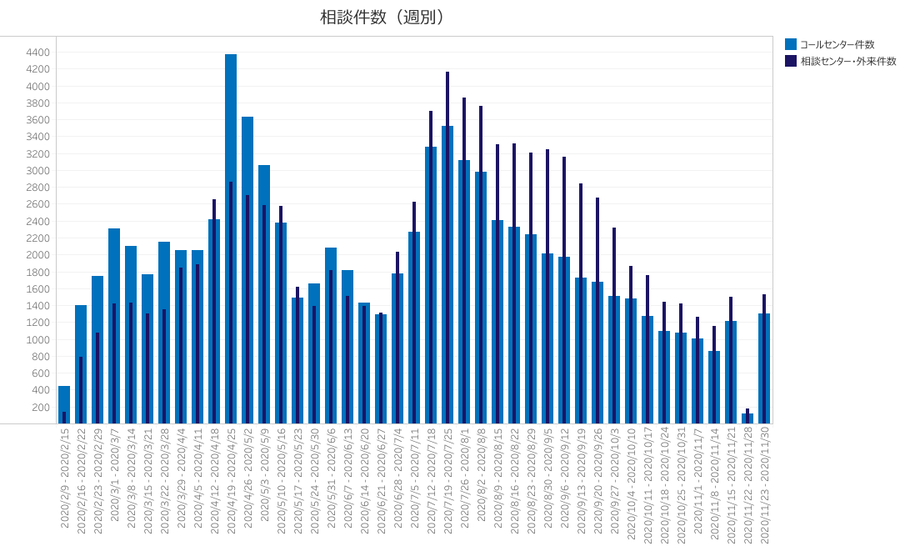
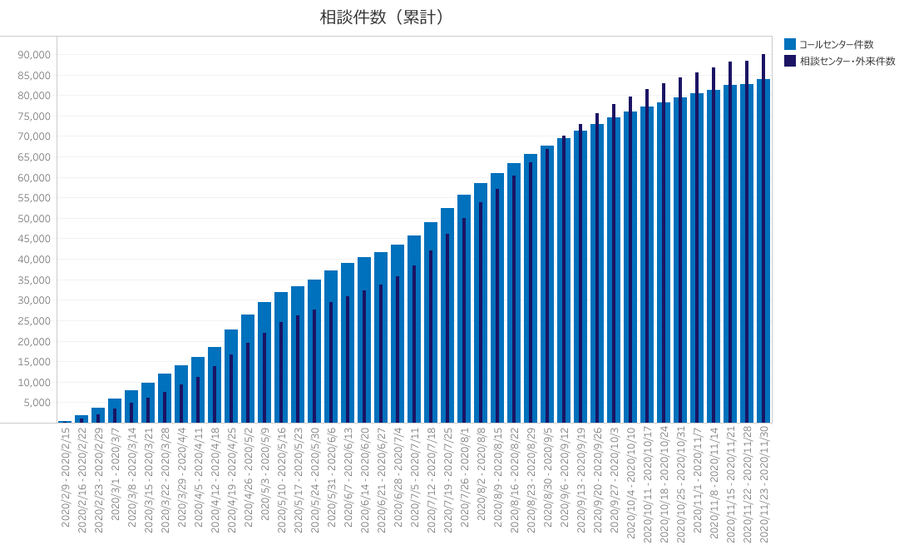
Number of call center consultations until November 30, 2020
From December 1, 2020, the Yokohama City COVID-19 Infectious Disease Call Center and the Returnee / Contact Consultation Center have been unified, and the 24-hour shift has been made to a separate graph.
Until November 30, 2020
Inquiries about ts graph data
Health and Safety Division, Medical Care Bureau Health and Safety Department
Telephone: 045-671-2463
Fax: 045-664-7296
Email address: ir-kenkoanzen@city.yokohama.jp
Vaccine-related data
[Omicron shares] (As of April 25, 2023)
Number of inoculations
1,656,115 vaccinations against Omicron variants
(of which 726,764 persons aged 65 and over)
3rd time 114,309 4th time 718,882 5th time 822,873
Inoculation rate meter
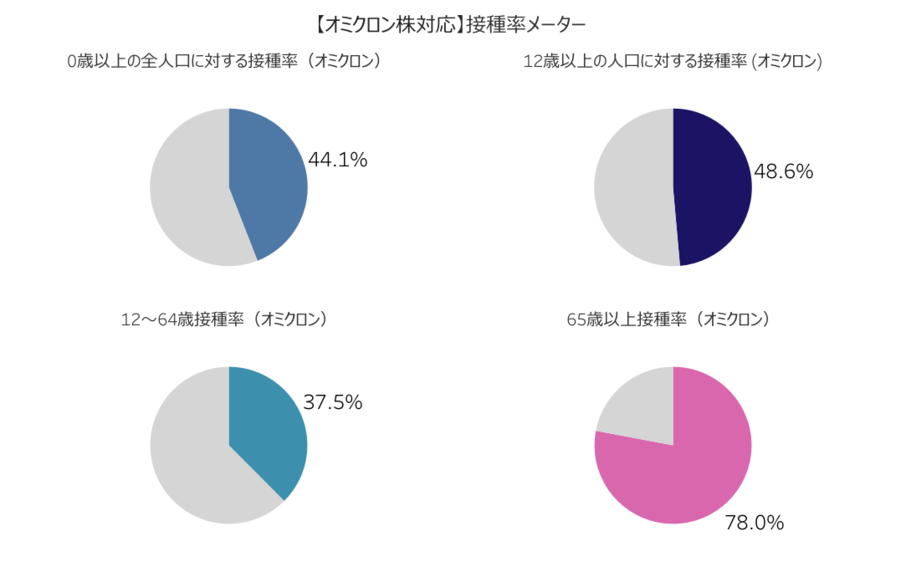
As of April 25, 2023
The vaccination rate for the total population aged 0 and over is 44.1%.
The vaccination rate for the population aged 12 and over is 48.6%.
The inoculation rate between the ages of 12 and 64 is 37.5%.
The vaccination rate for those aged 65 and over is 78.0%.
※Healthcare workers who have been vaccinated without vaccination coupons and residents of facilities for the elderly are not included in the number of vaccinations or vaccination rates until they are registered in VRS.
Trends in Inoculation Rates ( Trends)
![[Omicron shares] Changes in the inoculation rate for the total population aged 0 and over, and the inoculation rate for the population aged 12 and over.](https://www.city.yokohama.lg.jp/kenko-iryo-fukushi/kenko-iryo/yobosesshu/kansensho/coronavirus/data/covid19_data_archive.images/omicron_sessyuritsu_0sai_12sai.png) Changes in the inoculation rate for the total population aged 0 and over, and the inoculation rate for the population aged 12 and over (tendance)
Changes in the inoculation rate for the total population aged 0 and over, and the inoculation rate for the population aged 12 and over (tendance)
![[Omicron shares] Graph of transition (tradition) of inoculation rate of 12-64 years old, inoculation rate of 65 years old or older, inoculation rate](https://www.city.yokohama.lg.jp/kenko-iryo-fukushi/kenko-iryo/yobosesshu/kansensho/coronavirus/data/covid19_data_archive.images/omicron_sessyuritsu_12-64sai_65sai.png) 12-64-year-old vaccination rate, 65-year-old and older vaccination rate (tradition)
12-64-year-old vaccination rate, 65-year-old and older vaccination rate (tradition)
Inoculation rate by age
![[Omicron shares] Graph of inoculation rate by age](https://www.city.yokohama.lg.jp/kenko-iryo-fukushi/kenko-iryo/yobosesshu/kansensho/coronavirus/data/covid19_data_archive.images/omicron_nenndaibetsusessyuritsu.png)
As of April 25, 2023
The inoculation rate for teens (from 12 to 19 years old) is 26.3%.
The vaccination rate in their twenties is 24.4%.
The vaccination rate in their thirties is 27.3%.
The vaccination rate in their 40s is 34.7%.
The vaccination rate in their 50s is 51.9%.
The vaccination rate in their 60s is 67.8%.
The vaccination rate in their 70s is 77.3%.
The vaccination rate for those in their 80s or older is 84.6%.
Number of vaccinations and vaccination rates (12 years old or older)
![[Omicron shares] Graph of distinction number of inoculations and inoculation rate (12 years old or older)](https://www.city.yokohama.lg.jp/kenko-iryo-fukushi/kenko-iryo/yobosesshu/kansensho/coronavirus/data/covid19_data_archive.images/ku.jpg)
※The distinction vaccination rate uses the population aged 12 years or older.
※Due to preliminary figures, this data may cause errors in the total number of vaccinations and the total number of differentiated vaccinations. Errors are revised as soon as they are found.
[4th time] (As of April 25, 2023)
Number of inoculations
Number of fourth doses: 1,683,524
Number of vaccinations over 60 years old (4th time) 953,694 people
Number of vaccinations aged 18 to 59 (4th time) 697,562
Inoculation rate meter
![[4th time] Graph of inoculation rate meter](https://www.city.yokohama.lg.jp/kenko-iryo-fukushi/kenko-iryo/yobosesshu/kansensho/coronavirus/data/covid19_data_archive.images/sessyutitsu_me-ta-_4.png)
As of April 25, 2023, the vaccination rate for those aged 60 and over (the fourth time) is 83.6%.
※Due to preliminary figures, this data may cause errors in the total number of vaccinations and the total number of vaccinations by age. Errors are revised as soon as they are found.
Trends in Inoculation Rates ( Trends)
![[4th time] Graph of transition (tradition) of inoculation rate for population aged 60 and over](https://www.city.yokohama.lg.jp/kenko-iryo-fukushi/kenko-iryo/yobosesshu/kansensho/coronavirus/data/covid19_data_archive.images/4kaime_suii.png)
Inoculation rate by age
![[4th vaccination] Graph of inoculation rate by age](https://www.city.yokohama.lg.jp/kenko-iryo-fukushi/kenko-iryo/yobosesshu/kansensho/coronavirus/data/covid19_data_archive.images/4nenndaibetsu.png)
As of April 25, 2023
The vaccination rate in their 60s is 74.7%.
The vaccination rate in their 70s is 84.6%.
The vaccination rate for those in their 80s or older is 93.9%.
Number of Inoculations and Rates (60 years old or older)
![[4th vaccination] Graph of distinction number of inoculations and inoculation rate (60 years or older)](https://www.city.yokohama.lg.jp/kenko-iryo-fukushi/kenko-iryo/yobosesshu/kansensho/coronavirus/data/covid19_data_archive.images/60sai.jpg)
※The distinction vaccination rate uses the population over 60 years old.
※Due to preliminary figures, the data may cause errors in the number of vaccinations aged 60 and over and the total number of separate vaccinations. Errors are revised as soon as they are found.
[Third] (As of April 25, 2023)
Number of inoculations
Number of third doses: 2,598,963
Inoculation rate meter
![[Third] Graph of inoculation rate meter](https://www.city.yokohama.lg.jp/kenko-iryo-fukushi/kenko-iryo/yobosesshu/kansensho/coronavirus/data/covid19_data_archive.images/3sessyume-ta-.png)
As of April 25, 2023
The inoculation rate (third) for the total population aged 0 and over is 69.2%.
The inoculation rate (third) for the population aged 12 and over is 75.8%.
The inoculation rate (third) between the ages of 12 and 64 is 68.7%.
The vaccination rate for those aged 65 and over (the third time) is 94.4%.
※Healthcare workers who have been vaccinated without vaccination coupons and residents of facilities for the elderly are not included in the number of vaccinations or vaccination rates until they are registered in VRS.
Trends in Inoculation Rates ( Trends)
![[Third dose] Graph of changes (traditions) in the inoculation rate for the total population aged 0 and over and the inoculation rate for the population aged 12 and over](https://www.city.yokohama.lg.jp/kenko-iryo-fukushi/kenko-iryo/yobosesshu/kansensho/coronavirus/data/covid19_data_archive.images/3_0sai_12sai.png) Changes in the inoculation rate for the total population aged 0 and over, and the inoculation rate for the population aged 12 and over (tendance)
Changes in the inoculation rate for the total population aged 0 and over, and the inoculation rate for the population aged 12 and over (tendance)
![[Third dose] Graph of transition (tradition) of inoculation rate of 12-64 years old, inoculation rate of 65 years old or older, inoculation rate](https://www.city.yokohama.lg.jp/kenko-iryo-fukushi/kenko-iryo/yobosesshu/kansensho/coronavirus/data/covid19_data_archive.images/3_12-64sai_65-.png) 12-64-year-old vaccination rate, 65-year-old and older vaccination rate (tradition)
12-64-year-old vaccination rate, 65-year-old and older vaccination rate (tradition)
Inoculation rate by age
![[Third dose] Graph of inoculation rate by age](https://www.city.yokohama.lg.jp/kenko-iryo-fukushi/kenko-iryo/yobosesshu/kansensho/coronavirus/data/covid19_data_archive.images/3nenndaibetsu.png)
As of April 25, 2023
The vaccination rate between the ages of 0 and 4 is 2.7%.
The vaccination rate between the ages of 5 and 11 is 6.5%.
The inoculation rate between the ages of 12 and 19 is 49.0%.
The vaccination rate in their twenties is 60.3%.
The vaccination rate in their thirties is 62.2%.
The vaccination rate in their 40s is 67.1%.
The vaccination rate in their 50s is 82.0%.
The vaccination rate in their 60s is 88.8%.
The vaccination rate in their 70s is 91.5%.
The vaccination rate for those in their 80s or older is 103.6%.
Number of vaccinations and vaccination rates (12 years old or older)
![[Third dose] Graph of distinction number of inoculations and inoculation rate (12 years old or older)](https://www.city.yokohama.lg.jp/kenko-iryo-fukushi/kenko-iryo/yobosesshu/kansensho/coronavirus/data/covid19_data_archive.images/3kubetsu.jpg)
※The distinction vaccination rate uses the population aged 12 years or older.
※Due to preliminary figures, this data may cause errors in the total number of vaccinations and the total number of differentiated vaccinations. Errors are revised as soon as they are found.
[2nd] (As of April 4, 2023)
※The data on the first and second vaccinations is updated once a month, and the update on April 4, 2023 is the last update.
Number of inoculations
Number of second doses: 3,026,818
Inoculation rate meter
![[2nd vaccination] Graph of inoculation rate meter](https://www.city.yokohama.lg.jp/kenko-iryo-fukushi/kenko-iryo/yobosesshu/kansensho/coronavirus/data/covid19_data_archive.images/2sessyu_me-ta-.png)
As of April 4, 2023
The inoculation rate (second time) for all populations over 0 years old is 80.6%.
The inoculation rate (second time) for population aged 12 and over is 87.7%.
The inoculation rate (second time) between the ages of 12 and 64 is 85.3%.
The vaccination rate for those aged 65 and over (second time) is 94.1%.
Trends in Inoculation Rates ( Trends)
![[1st and 2nd vaccination] Graph of transition (tradition) of inoculation rate of 12-64 years old, inoculation rate of 65 years old or older, inoculation rate](https://www.city.yokohama.lg.jp/kenko-iryo-fukushi/kenko-iryo/yobosesshu/kansensho/coronavirus/data/covid19_data_archive.images/1-2_12-64sai_suii.png) 12-64-year-old vaccination rate, 65-year-old and older vaccination rate (tradition)
12-64-year-old vaccination rate, 65-year-old and older vaccination rate (tradition)
![[1st and 2nd vaccination] Trends in the inoculation rate for the total population aged 0 and over and the inoculation rate for the population aged 12 and over.](https://www.city.yokohama.lg.jp/kenko-iryo-fukushi/kenko-iryo/yobosesshu/kansensho/coronavirus/data/covid19_data_archive.images/1-2_0sai_12sai_suii.png) Changes in the inoculation rate for the total population aged 0 and over, and the inoculation rate for the population aged 12 and over (tendance)
Changes in the inoculation rate for the total population aged 0 and over, and the inoculation rate for the population aged 12 and over (tendance)
Inoculation rate by age
![[2nd vaccination] Graph of inoculation rate by age](https://www.city.yokohama.lg.jp/kenko-iryo-fukushi/kenko-iryo/yobosesshu/kansensho/coronavirus/data/covid19_data_archive.images/2nenndaibetsu.png)
As of April 4, 2023
The vaccination rate between the ages of 0 and 4 is 4.1%.
The vaccination rate between the ages of 5 and 11 is 15.7%.
The inoculation rate between the ages of 12 and 19 is 73.1%.
The vaccination rate in their twenties is 83.0%.
The vaccination rate in their thirties is 82.8%.
The vaccination rate in their 40s is 83.4%.
The vaccination rate in their 50s is 92.2%.
The vaccination rate in their 60s is 93.2%.
The vaccination rate in their 70s is 92.7%.
The vaccination rate for those in their 80s or older is 98.9%.
Number of vaccinations and vaccination rates (12 years old or older)
![[2nd vaccination] Graph of distinction number of inoculations and inoculation rate (12 years old or older)](https://www.city.yokohama.lg.jp/kenko-iryo-fukushi/kenko-iryo/yobosesshu/kansensho/coronavirus/data/covid19_data_archive.images/2kubetsu.jpg)
※The distinction vaccination rate uses the population aged 12 years or older.
Changes in vaccine supply to the city (cumulative)
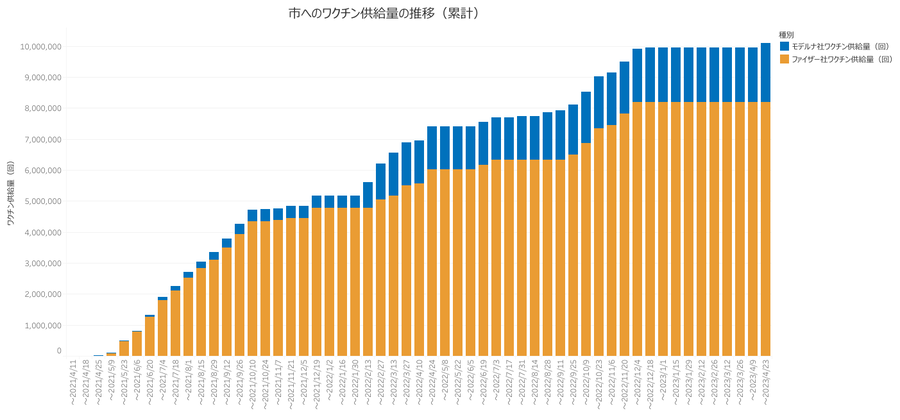
As of April 23, 2023
The cumulative supply of Pfizer vaccine is 8,187,270 doses.
The cumulative supply of Moderna vaccine is 1,903,870 doses.
※Indicates the amount directly supplied to the city, and does not include the amount of work area vaccinations or the amount of supply to suburban venues.
Vaccine supply to medical institutions, group vaccination, and large-scale vaccination sites
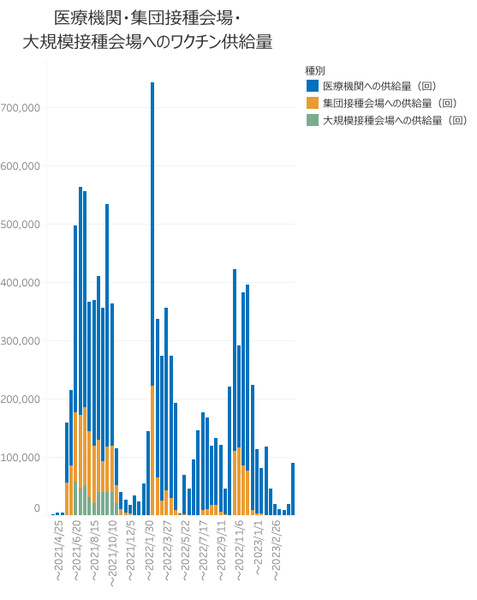
April 10, 2023 to April 23, 2023
The supply to medical institutions is 89,350 times.
The supply to the group vaccination venue is 0 times.
Classification of large-scale inoculation site is for the first and second inoculation.
In the third vaccination, it will be a medical institution or group vaccination venue.
Calculation basis for inoculation rate
■Number of inoculations (molecules)
・Data recorded in the vaccination record system (VRS) and aggregated data is used (including healthcare professionals, etc.).
・Workplace vaccination records only include records read by vaccination coupons in VRS.
・The number of vaccinations at the 3rd, 4th, and 5th includes the number of vaccinations for Omicron strains.
※The vaccination record registration for VRS may be done at a later date, not on the day of vaccination, so the number of past vaccination days may increase late.
※Because calculation method of inoculation rate of country was changed from September 1, 2022, about inoculation rate of Motoichi, we exclude the number of inoculations of fatalities during 2021.
■Number of Subjects (Denominator)
"[Total] Population by Basic Resident Register Age Class (Municipalities) 2022 (hereinafter referred to as "Population, demographics and Number of Households Based on the Basic Resident Register" on the Ministry of Internal Affairs and Communications website (hereinafter referred to as "Municipalities") File by municipality) "(Excel file). Of these, we use the numbers of gender and age class in Yokohama City. (As of January 1, 2022)
[1st to 3rd vaccination against Omicron variants]
・The denominator of the inoculation rate for the total population over the age of 0 uses the total population over the age of 0 (3,755,793).
・The denominator of the inoculation rate for the population aged 12 and over uses the population aged 12 and over (3,407,417).
・The denominator of the inoculation rate between the ages of 12 and 64 uses the population (2,475,338) between the ages of 12 and 64.
・The denominator of the vaccination rate for those aged 65 and over uses the population aged 65 and over (932,079).
[1st to 3rd inoculation only]
・The denominator of the inoculation rate from 0 to 4 years old uses the population (133,268 people) from 0 to 4 years old.
・The denominator of the vaccination rate between the ages of 5 and 11 uses the population (215,091) between the ages of 5 and 11.
[4th vaccination only]
・The denominator of the vaccination rate for those over 60 years old uses the population over 60 years old (1,141,118 people).
※In calculating the vaccination rate from 5 to 11 years old, the sum of the 5 to 9 years old population of 10 to 14 years old population divided by 2/5 of the population of 10 to 14 years old is 5 to 11 years old We use as population until age.
※In calculating the inoculation rate for those aged 12 and over, we use three-fifths of the population aged 10 to 14 (total) in the file for each municipality as the population between the ages of 12 and 14.
※Regarding the data related to the third vaccination, since the number of people eligible for the third vaccination has been expanded to 12 years or older, the data as of April 5, 2022 uses the population aged 12 or older as the denominator.
※Regarding the fourth vaccination-related data, the population aged 60 and over is used as the denominator from the data as of July 5, 2022.
※The inoculation rate by age group may exceed 100% depending on demographics because the calculation reference date for denominator (file by municipality (as of January 1, 2022)) and molecules (data extraction date from VRS) are different. May be.
※About change of each inoculation rate, we show as trend.
Notes
Vaccination-related data tells the current vaccination status from various perspectives.
The COVID-19 vaccine is intended to be vaccinated on your own after understanding both the effects of prevention and the risk of side reactions, and requires people around you to be vaccinated, Please do not treat people who have not been vaccinated discriminatoryly.
(4th time)
Inoculation rate numerical value (denominator / distinction (4th vaccination)) Download open data (CSV: 265 bytes)
Inoculation rate numerical value (denominator / age (4th vaccination)) Download open data (CSV: 85bytes)
Inoculation rate numerical value (molecule) Download open data (CSV: 8,106KB)
(3rd time)
Inoculation rate numerical value (denominator / distinction (third inoculation)) Download open data (CSV: 340 bytes)
Inoculation rate numerical value (denominator / age (third vaccination)) Download open data (CSV: 207bytes)
Inoculation rate numerical value (molecule) Download open data (CSV: 8,106KB)
(1st and 2nd time)
Inoculation rate numerical value (denominator / distinction (1st and 2nd inoculation)) Download open data (CSV: 340 bytes)
Inoculation rate numerical value (Denominator / Age (1st and 2nd inoculation)) Download open data (CSV: 207bytes)
Inoculation rate numerical value (molecule) Download open data (CSV: 8,106KB)
(Vaccinal supply)
Vaccine supply (whole) Download open data (CSV: 5KB)
Download open data of vaccine supply to medical institutions, group vaccination venues, and large-scale vaccination venues (CSV: 7KB)
Inquiries about this graph data
COVID-19 vaccination call center
Telephone: 0120-045-070 Please be careful not to make a mistake.
Fax: 050-3588-7191 For inquiries for hearing-impaired people
Situation of positive patient receiving beds (until May 7, 2023)
Changes in the number of beds secured and the use of beds
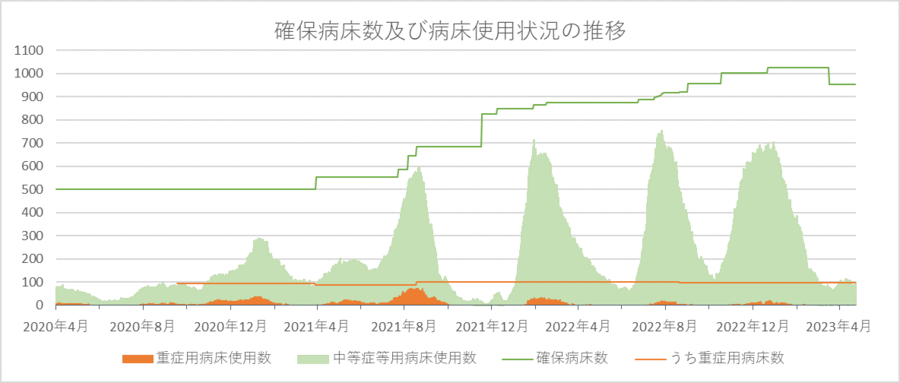
※Created in Medical Care Bureau based on reports from city medical institutions
※Excluding prefectural hospitals
Download open data on the number of secured beds (CSV: 118KB)
Download open data on the number of beds used (CSV: 78KB)
Changes in the use of beds for severe illness
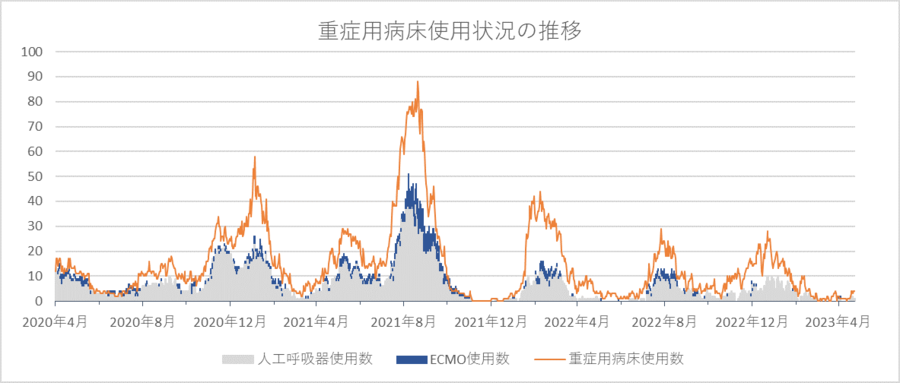
※ Created in Medical Care Bureau based on reports from city medical institutions
※ ECMO (: Out-of-vitro membrane-type human pulmonary
※Excluding prefectural hospitals
Download open data on severely ill beds, respirators, and ECMO usage (CSV: 81KB)
Inquiries about this graph data
Medical Policy Division, Medical Care Bureau Medical Policy Department
Telephone: 045-671-2466 Fax: 045-664-3851
Email address: ir-seisaku@city.yokohama.jp
Status of Infections at Yokohama City Schools As of May 7, 2023
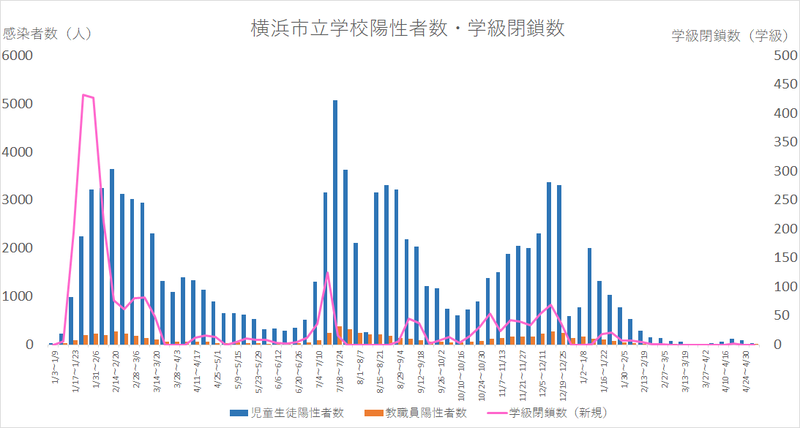
※elementary school student students are counted on the date of reporting and faculty members are counted on the date of discovery.
※The number of class closures is calculated on a weekly basis for the number of newly closed classes.
Status of infections at Yokohama City Schools (Open Data) (CSV: 3KB) (CSV: 3KB) (CSV: 3KB)
Inquiries about this graph data
Board of Education Secretariat Human Rights and Health Education Department Health Education and Food Education Division
Telephone: 045-671-3234 Fax: 045-681-1456
Email address: ky-kenkokyoiku@city.yokohama.jp
Status of Infections at daycare centers, etc. As of May 7, 2023
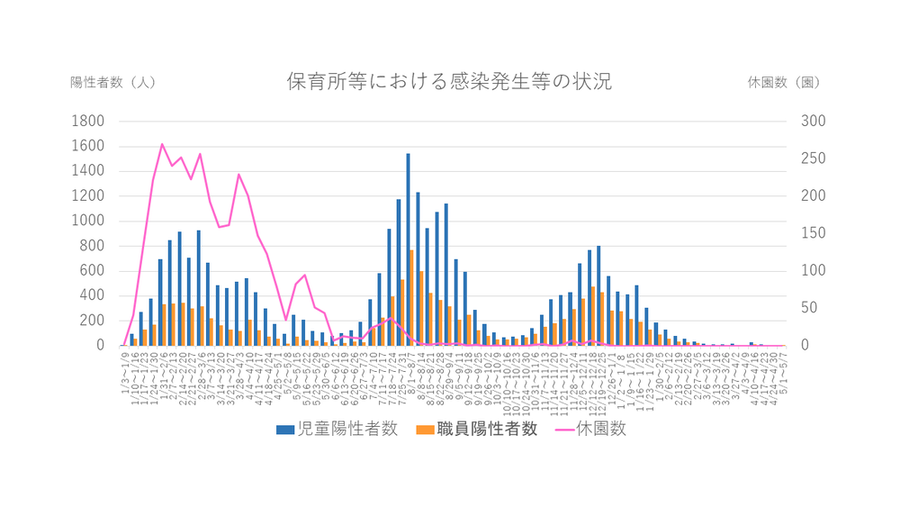
※From June 6, 2022, the handling of closed gardens has been changed.
In the past, the park was closed for 7 days from the day after the last day of the positive person, but after the change, the period until the close contact person is identified, and the scope of coverage is limited to the applicable class only.
※Since July 25, 2022, we have decided not to identify close contacts, and closed the park only when it is difficult to maintain the childcare system due to infection of childcare workers.
Status of infections at daycare centers (open data) (CSV: 3KB) (CSV: 3KB) (CSV: 3KB)
Inquiries about this graph data
Child and Youth Bureau Childcare and Education Administration Division
Telephone: 045-671-3564 Fax: 045-664-5479
Email address: kd-unei@city.yokohama.jp
Status of Emergency Participation, etc. As of May 7, 2023
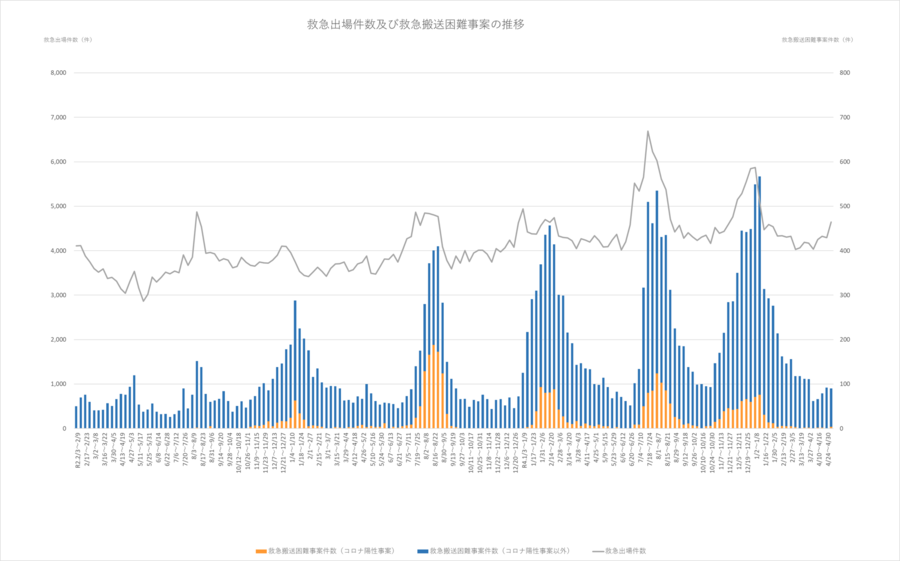
※Emergency transport difficulties refer to cases of "at least 4 times of referrals to medical institutions by emergency services" and "at least 30 minutes of on-site stay time".
Number of emergency participation and emergency transport difficult cases (open data) (CSV: 3KB) (CSV: 3KB) (CSV: 3KB)
Inquiries about this graph data
Emergency Planning Division, Fire Bureau Emergency Department
Telephone: 045-334-6771 Fax: 045-334-6785
Email address: sy-kyukyu@city.yokohama.jp
Status of Positive Patients (data until September 26, 2022)
Data up to the limitation of those who are subject to outbreak notification will be posted.
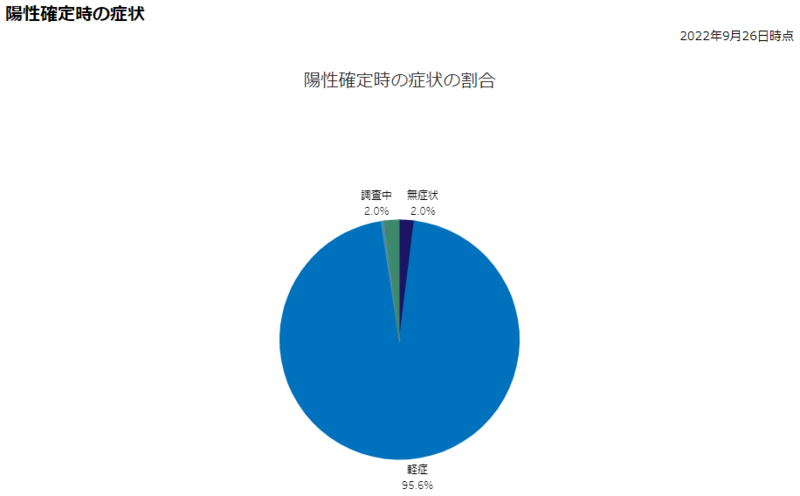
Symptoms at the time of positive confirmation
Percentage of symptoms at the time of positive confirmation As of September 26, 2022
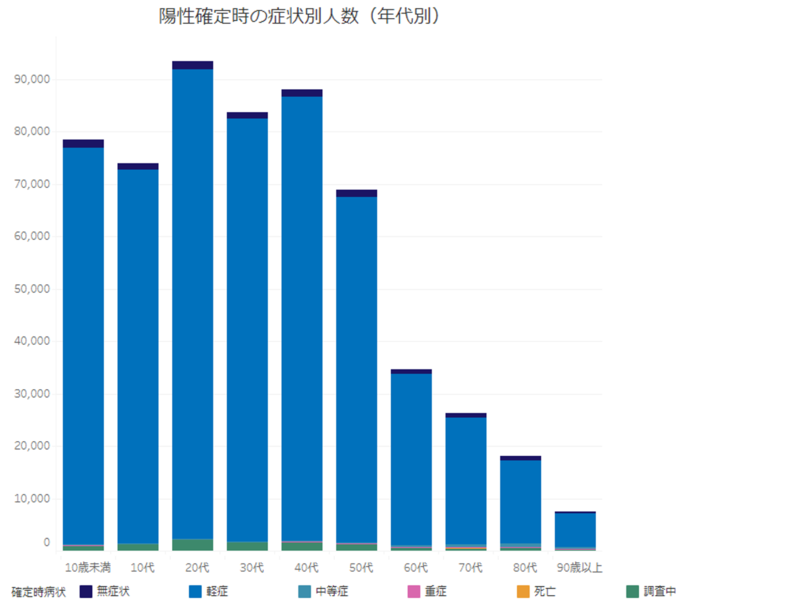
Number of people by symptoms (by age) As of September 26, 2022
Changes in the percentage of positive patients by age
Changes in the percentage of positive patients by age (monthly) As of September 26, 2022
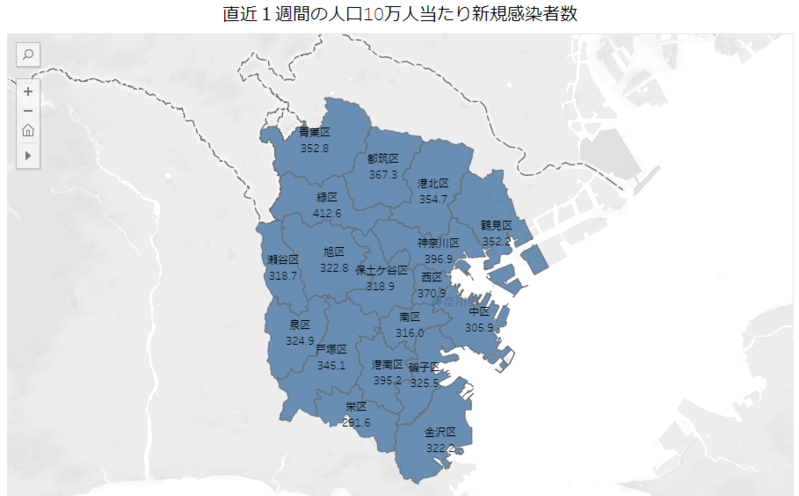
Status of distinction
Number of newly infected people per 100,000 population in the last week As of September 22, 2022
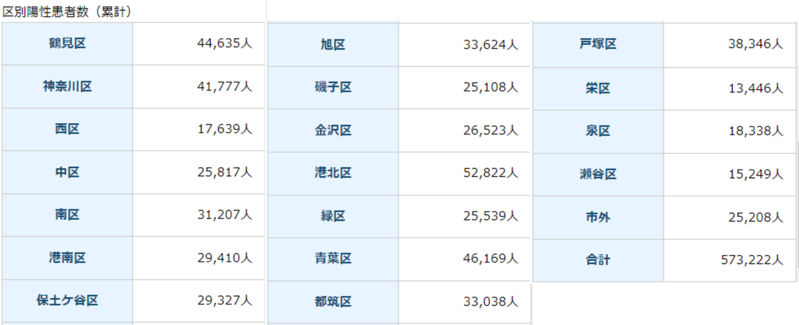
Number of positive patients (cumulative) As of September 26, 2022
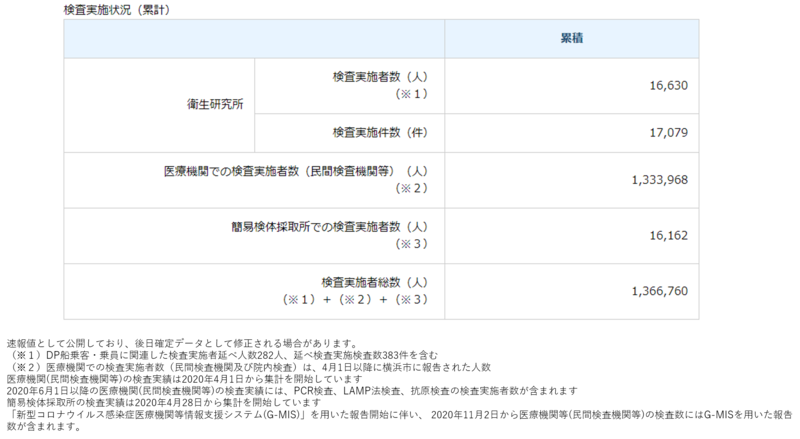
Number of PCR tests
Inspection status (cumulative) As of July 17, 2022
Download open data for the number of PCR tests (after November 1, 2020)
Download open data of the number of PCR tests (prior to October 31, 2020)
Number of inspectors in the city and positive ratio As of July 17, 2022
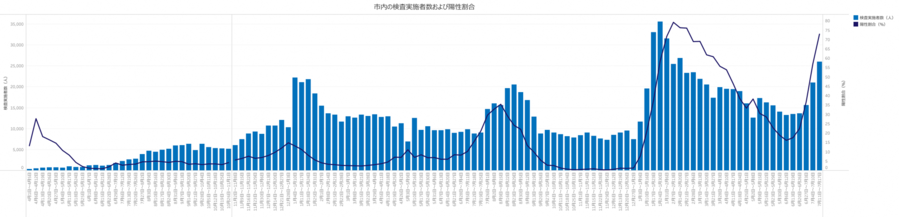
• The positive percentage from April 1, 2020 to November 1, 2020 indicates the positive percentage in the total number of tests excluding tests for negative confirmation.
• The positive rate after November 2, 2020 is calculated based on the total number of tests reported to the city and the number of positive people reported using the "Information grasping and management support system for people infected with COVID-19 (HER-SYS)". I am.
• Since the number of inspections has a time lag before reporting, the above data is preliminary. The number may be updated at a later date.
Inquiries to this page
Health and Safety Division, Medical Care Bureau Health and Safety Department
Telephone: 045-671-4182
Telephone: 045-671-4182
Fax: 045-664-7296
Email address: ir-kenkoanzen@city.yokohama.lg.jp
Page ID: 672-511-651


