


- Yokohama-shi Top Page
- Municipal Government Information
- Policy and Initiatives
- Major Initiatives
- Policy support
- Future Population Estimation of Yokohama City
Here's the text.
Future Population Estimation of Yokohama City
Last Updated July 3, 2024
Future Population Estimation of Yokohama City
Estimation period
With 2020 as the base point, estimates were made for each year until 2070.
Estimation method
Cohort Factor Method
The Cohort Factor Act estimates the future population by assuming future values for each cohort (group born in the same year or in the same period) for birth, death, transfer, and transfer, which are factors of population increase or decrease.
Furthermore, in this estimation, provisional values for the future values of birth and death are set for the high (the case where there are many births and few deaths) and the low (the case where there are many births and many deaths), and the high and low estimates are made. Was.
Overview of Estimation Method (Yokohama City) (PDF: 259KB)
Overview of Estimation Results (Middle Estimation)
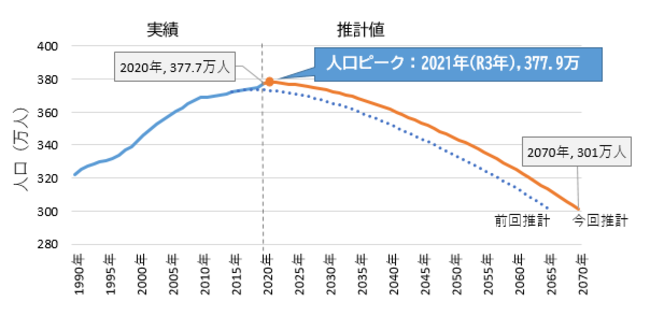
- The population of Yokohama City peaked at 3,779,000 in 2021, and has continued to decline since then.
- In 50 years, it will decrease by about 20% to 3.01 million.
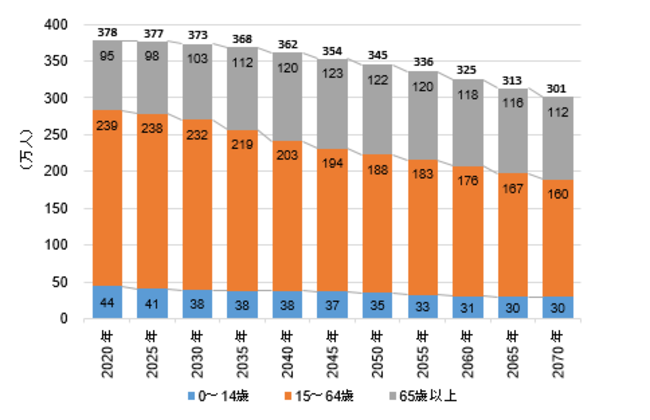
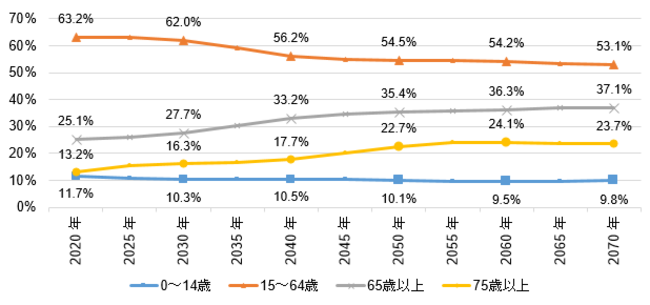
- The population aged 65 and over peaked in 2047, reaching 1,227,000, about 35% of the population.
Estimation results (medium estimation)
Population by gender, age, age, age 3, age 4, age 5, age 5 (Excel: 163KB) in Yokohama City
Demographics of Yokohama-shi (birth, death, transference, transference) (Excel: 12KB)
Estimation of future population of Yokohama City
| Results | 2020 | 2025 | 2030 | 2035 | 2040 | 2045 | 2050 | 2055 | 2060 | 2065 | 2070 |
|---|---|---|---|---|---|---|---|---|---|---|---|
| Medium-term Estimation | 3,777 | 3,766 | 3,733 | 3,685 | 3,617 | 3,535 | 3,449 | 3,356 | 3,250 | 3,133 | 3,013 |
(Unit: 1,000)
Future Population Estimation of Yokohama City: Population for three age categories
Future Population Estimated in Yokohama City: Percentage of 3 age categories
Results of high-level and low-level estimates
This is an estimate of the future changes in birth and death by setting the high and low provisional values for each.
Population estimation of each administrative district
Estimation period
With 2020 as the base point, estimates were made for each year until 2070.
Estimation method
Cohort Factor Method
Outline of estimation method (administrative distinction) (PDF: 237KB)
※Estimated values are only medium estimates.
Overview of Estimation Results (Middle Estimation)
- As the population of the entire city continues to decline, the population of the five wards (Tsurumi Ward, Kanagawa Ward, Nishi Ward, Naka Ward and Kohoku Ward) exceeds the population of 2020 as of 2070.
- Of the above five wards, the population will continue to grow in Nishi Ward during the period, while the other four wards will peak between 2040 and 2060 and turn to population decline.
Estimation Results
Population by gender, age, age, age, age, age, age 4, age 5, age group (Excel: 2,509KB)
Population dynamics by administrative district (birth, death, transference, transference) (Excel: 96KB)
Household estimates for Yokohama City and Administrative Districts
Estimation period
With 2020 as the base point, estimates were made every five years until 2070.
Estimation method
Household Owner Ratio Act
In this estimation, based on the results of the census, future householder rates are set based on past trends in householder rates by gender, age 5-year-old class, and family type, and estimated by multiplying the estimated population. I did it.
Overview of estimation method of the number of households (Yokohama-shi, administrative distinction) (PDF: 242KB)
Overview of Estimation Results
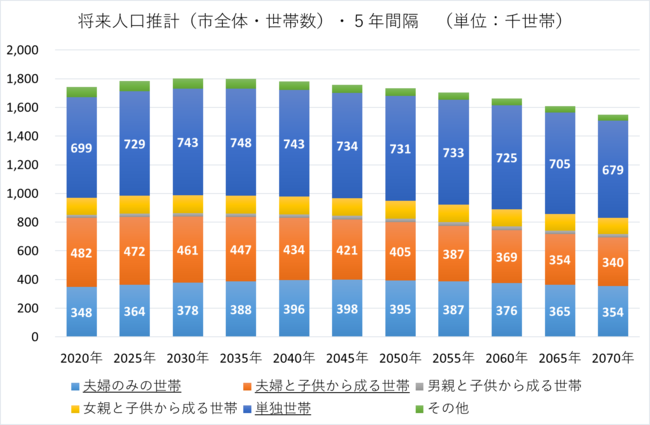
- The total number of households in the entire city peaks between 2030 and 2035 and begins to decrease.
- By family type of city as a whole, "single households" are the most common, followed by "households consisting of couples and children" and "households only for couples", but from 2055 to 2060 "households consisting of couples and children" exceeds.
- The percentage of "single households" in each administrative district to the total number of households will increase in 17 wards excluding Nishi Ward. In addition, the percentage of "households with only couples" will increase in all wards, and the percentage of "households consisting of couples and children" will decrease.
Estimation Results
Number of households by family type (Yokohama-shi, administrative distinction) (Excel: 29KB)
Number of households by gender, age 5-year-old class, family type (Yokohama-shi, administrative distinction) (Excel: 483KB)
Estimation of the number of households by family type in Yokohama City
Related information
National Institute of Population and Social Security Research
Future Estimated Population of Japan-Reiwa 5 (2023) Estimated-(outside site)
Future Estimated Population by Region in Japan-Reiwa 5 (2023) Estimated-(outside site)
Open data
[Reference] Previous (2017) Estimation Results
About the use of open data
The open data posted on this page is provided under a Creative Commons Attribution 4.0 International License.
![]()
For details, please refer to the link below.
https://creativecommons.org/licenses/by/4.0/legalcode.ja (external site)
You may need a separate PDF reader to open a PDF file.
If you do not have it, you can download it free of charge from Adobe.
![]() To download Adobe Acrobat Reader DC
To download Adobe Acrobat Reader DC
Inquiries to this page
Management Strategy Division, Management Strategy Department, Policy Management Bureau
Telephone: 045-671-3477
Telephone: 045-671-3477
Fax: 045-663-4613
Email address: ss-kisochousa@city.yokohama.jp
Page ID: 312-573-379


